Agent-based Scorer (aka. Agent-as-a-Judge)
Agent-as-a-Judge represents a paradigm shift in LLM evaluation. Instead of simply assessing inputs and outputs, these judges act as autonomous agents equipped with tools to investigate your application's execution in depth.
How it works
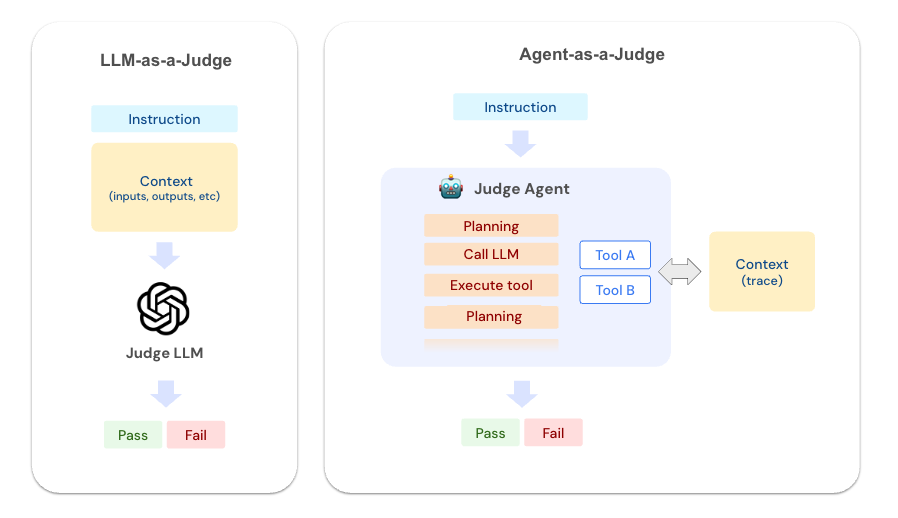
Agent-as-a-Judge uses the following tools to investigate traces logged to the MLflow backend. These tools enable the judge to act like an experienced debugger, systematically exploring your application's execution.
| Tool | Description |
|---|---|
GetTraceInfo | Retrieves high-level information about a trace including timing, status, and metadata. |
ListSpans | Lists all spans in a trace with their hierarchy, timing, and basic attributes. |
GetSpan | Fetches detailed information about a specific span including inputs, outputs, and custom attributes. |
SearchTraceRegex | Searches for patterns across all span data using regular expressions. |
While it works for simple cases, traces from real-world applications are often large and complex. Passing the entire trace to LLM will quickly run into context window limit and degrade the judge accuracy. Agentic-approach uses tools to explore the trace structure and fetch the necessary details without eating up the context window.
Comparison with LLM-as-a-Judge
Understanding when to use each approach depends on where you are in your development lifecycle:
| Aspect | Agent-as-a-Judge | LLM-as-a-Judge |
|---|---|---|
| Ease of setup | Simple - just describe what to investigate | Requires careful prompt engineering and refinement |
| What they evaluate | Complete execution traces and trajectory | Specific inputs and outputs fields |
| Performance | Slower (explores trace in detail) | Fast execution |
| Cost | Higher (more context and tool usage) | Lower (less context) |
When to use Agent-as-a-Judge?
Agent-as-a-Judge is suitable for bootstrapping the evaluation flywheel.
- Getting started with a new application
- Revising and refining your agent
- Identifying failure patterns
- Understanding unexpected behavior
When to use LLM-as-a-Judge?
LLM-as-a-Judge is more efficient for evaluating a particular criteria, therefore suitable for continuous evaluation and production use.
- Production monitoring
- Regression testing
- Final validation before deployment
- Meeting specific quality expectations
Quickstart
To create an Agent-as-a-Judge, simply call the make_judge API and pass an instruction with the {{ trace }} template variable:
import mlflow
from mlflow.genai.judges import make_judge
from typing import Literal
import time

performance_judge = make_judge(
    name="performance_analyzer",
    instructions=(
        "Analyze the {{ trace }} for performance issues.\n\n"
        "Check for:\n"
        "- Operations taking longer than 2 seconds\n"
        "- Redundant API calls or database queries\n"
        "- Inefficient data processing patterns\n"
        "- Proper use of caching mechanisms\n\n"
        "Rate as: 'optimal', 'acceptable', or 'needs_improvement'"
    ),
    feedback_value_type=Literal["optimal", "acceptable", "needs_improvement"],
    model="openai:/gpt-5",
    # model="anthropic:/claude-opus-4-1-20250805",
)
The usage of {{ trace }} template variable is important. If the template does not contain {{ trace }}, MLflow assumes the scorer is a normal LLM-as-a-Judge and does not use MCP tools.
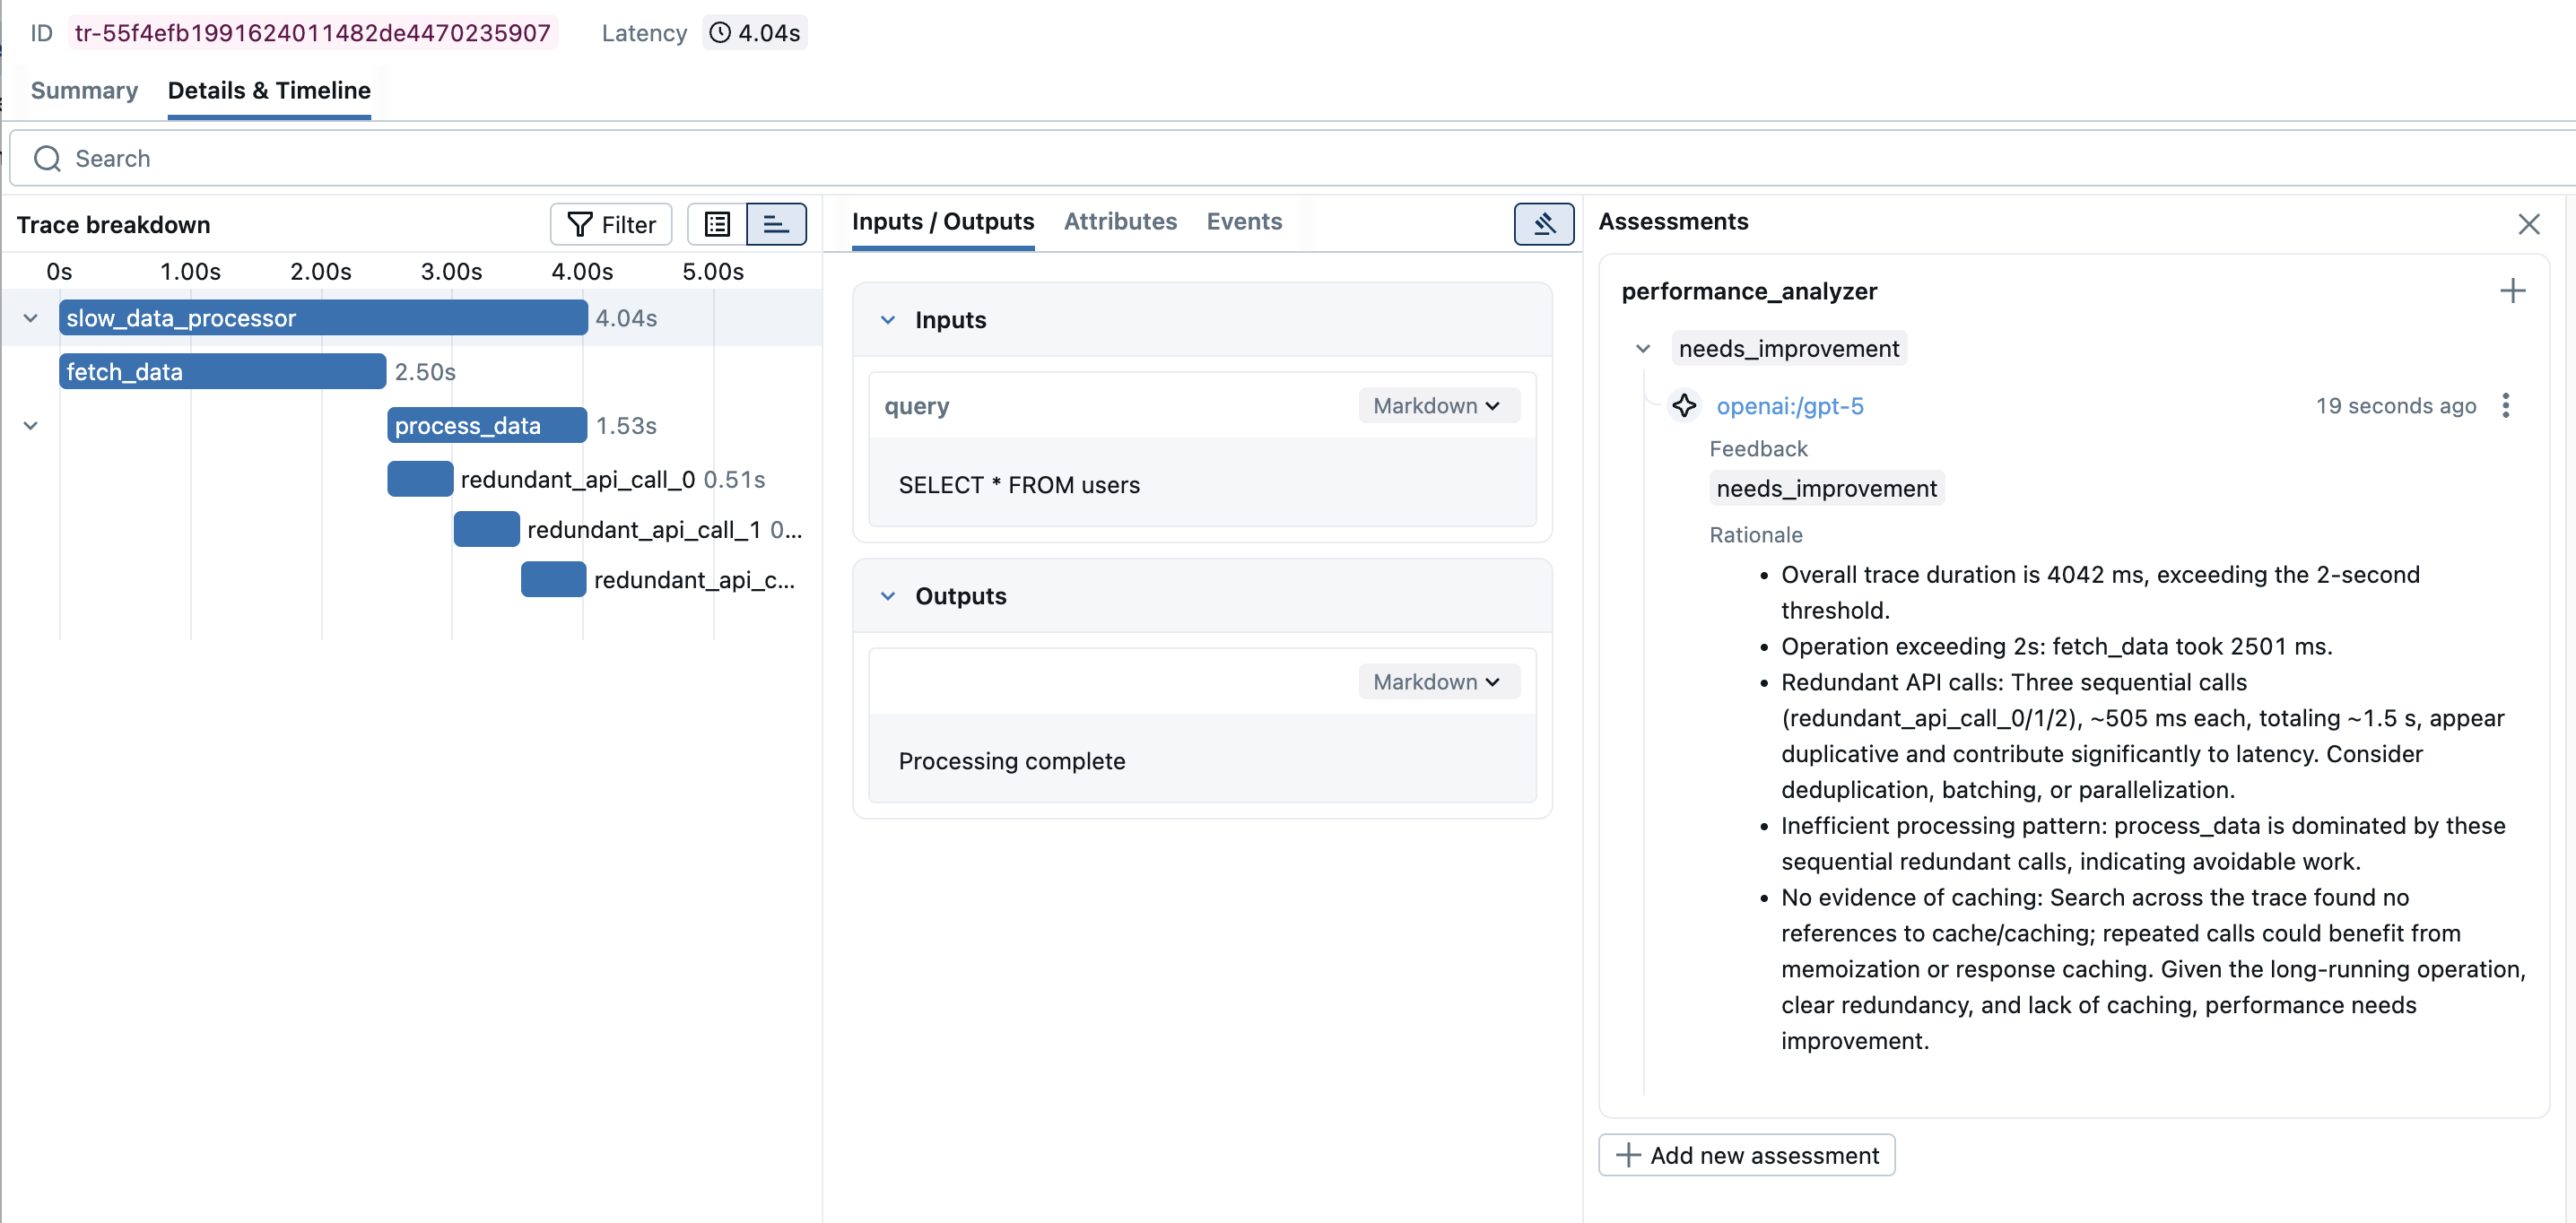
Then, generate a trace from your application and pass it to the scorer:
@mlflow.trace
def slow_data_processor(query: str):
    """Example application with performance bottlenecks."""
    with mlflow.start_span("fetch_data") as span:
        time.sleep(2.5)
        span.set_inputs({"query": query})
        span.set_outputs({"data": ["item1", "item2", "item3"]})

    with mlflow.start_span("process_data") as span:
        for i in range(3):
            with mlflow.start_span(f"redundant_api_call_{i}"):
                time.sleep(0.5)
        span.set_outputs({"processed": "results"})

    return "Processing complete"


result = slow_data_processor("SELECT * FROM users")
trace_id = mlflow.get_last_active_trace_id()
trace = mlflow.get_trace(trace_id)

feedback = performance_judge(trace=trace)

print(f"Performance Rating: {feedback.value}")
print(f"Analysis: {feedback.rationale}")
Performance Rating: needs_improvement
Analysis: Found critical performance issues:
1. The 'fetch_data' span took 2.5 seconds, exceeding the 2-second threshold
2. Detected 3 redundant API calls (redundant_api_call_0, redundant_api_call_1,
   redundant_api_call_2) that appear to be duplicate operations
3. Total execution time of 4 seconds could be optimized by parallelizing
   the redundant operations or implementing caching
Running the Judge against Batch Traces
To apply the scorer to a batch of traces, use the mlflow.genai.evaluate API.
import mlflow

# Retrieve traces from MLflow
traces = mlflow.search_traces(filter_string="timestamp > 1727174400000")

# Run evaluation with Agent-as-a-Judge
results = mlflow.genai.evaluate(
    data=traces,
    scorers=[performance_judge],
)
Advanced Examples
- Tool Usage Analysis
- Loop Detection
- Reasoning Analysis
- RAG Agent Evaluation
- Error Handling Assessment
tool_optimization_judge = make_judge(
    name="tool_optimizer",
    instructions=(
        "Analyze tool usage patterns in {{ trace }}.\n\n"
        "Check for:\n"
        "1. Unnecessary tool calls (could be answered without tools)\n"
        "2. Wrong tool selection (better tool available)\n"
        "3. Inefficient sequencing (could parallelize or reorder)\n"
        "4. Missing tool usage (should have used a tool)\n\n"
        "Provide specific optimization suggestions.\n"
        "Rate efficiency as: 'optimal', 'good', 'suboptimal', or 'poor'"
    ),
    feedback_value_type=Literal["optimal", "good", "suboptimal", "poor"],
    model="anthropic:/claude-opus-4-1-20250805",
)
loop_detector_judge = make_judge(
    name="loop_detector",
    instructions=(
        "Detect problematic loops in {{ trace }}.\n\n"
        "Identify:\n"
        "1. Infinite loop risks\n"
        "2. Unnecessary iterations\n"
        "3. Circular reasoning patterns\n"
        "4. Recursive calls without proper termination\n\n"
        "Report specific span patterns that indicate issues.\n"
        "Classify as: 'clean', 'warning', or 'critical'"
    ),
    feedback_value_type=Literal["clean", "warning", "critical"],
    model="anthropic:/claude-opus-4-1-20250805",
)
reasoning_judge = make_judge(
    name="reasoning_validator",
    instructions=(
        "Evaluate the reasoning chain in {{ trace }}.\n\n"
        "Analysis criteria:\n"
        "1. Logical Progression: Does each step follow logically from the previous?\n"
        "2. Assumption Validity: Are assumptions reasonable and stated?\n"
        "3. Evidence Usage: Is evidence properly cited and used?\n"
        "4. Conclusion Soundness: Does the conclusion follow from the premises?\n\n"
        "Identify specific reasoning flaws with span IDs.\n"
        "Score 1-100 for reasoning quality."
    ),
    feedback_value_type=int,
    model="anthropic:/claude-opus-4-1-20250805",
)
rag_judge = make_judge(
    name="rag_evaluator",
    instructions=(
        "Evaluate the RAG agent's behavior in {{ trace }}.\n\n"
        "Check for:\n"
        "1. Were the right documents retrieved?\n"
        "2. Is the response grounded in the retrieved context?\n"
        "3. Are sources properly cited?\n\n"
        "Rate as: 'good', 'acceptable', or 'poor'"
    ),
    feedback_value_type=Literal["good", "acceptable", "poor"],
    model="anthropic:/claude-opus-4-1-20250805",
)


# Use with your RAG pipeline
@mlflow.trace
def rag_pipeline(query):
    docs = retrieve_documents(query)
    response = generate_with_context(query, docs)
    return response


result = rag_pipeline("What is MLflow?")
trace = mlflow.get_last_active_trace()
evaluation = rag_judge(trace=trace)
error_handling_judge = make_judge(
    name="error_handler_checker",
    instructions=(
        "Analyze error handling in the {{ trace }}.\n\n"
        "Look for:\n"
        "1. Spans with error status or exceptions\n"
        "2. Retry attempts and their patterns\n"
        "3. Fallback mechanisms\n"
        "4. Error propagation and recovery\n\n"
        "Identify specific error scenarios and how they were handled.\n"
        "Rate as: 'robust', 'adequate', or 'fragile'"
    ),
    feedback_value_type=Literal["robust", "adequate", "fragile"],
    model="anthropic:/claude-opus-4-1-20250805",
)
Debugging Agent Judges
To see the actual MCP tool calls that the Agent-as-a-Judge makes while analyzing your trace, enable debug logging:
import logging

# Enable debug logging to see agent tool calls
logging.basicConfig(level=logging.DEBUG)
logger = logging.getLogger("mlflow.genai.judges")
logger.setLevel(logging.DEBUG)

# Now when you run the judge, you'll see detailed tool usage
feedback = performance_judge(trace=trace)
With debug logging enabled, you'll see output like:
DEBUG:mlflow.genai.judges:Calling tool: GetTraceInfo
DEBUG:mlflow.genai.judges:Tool response: {"trace_id": "abc123", "duration_ms": 4000, ...}
DEBUG:mlflow.genai.judges:Calling tool: ListSpans
DEBUG:mlflow.genai.judges:Tool response: [{"span_id": "def456", "name": "fetch_data", ...}]
DEBUG:mlflow.genai.judges:Calling tool: GetSpan with span_id=def456
DEBUG:mlflow.genai.judges:Tool response: {"duration_ms": 2500, "inputs": {"query": "SELECT * FROM users"}, ...}