Instrument Your App with MLflow Tracing
New to MLflow Tracing? Checkout the Quick Start Guide to get started.
Three Steps to Trace Your App/Agents
1. Installation
- Python
- JS/TS
Add mlflow to your Python environment.
pip install mlflow
Install the mlflow-tracing package and other auto-tracing integrations (e.g., mlflow-openai).
npm install mlflow-tracing
2. Instrumenting Your Application Logic
MLflow offers different ways to instrument your application logic. Follow the links below to learn more about each approach to instrument your application:
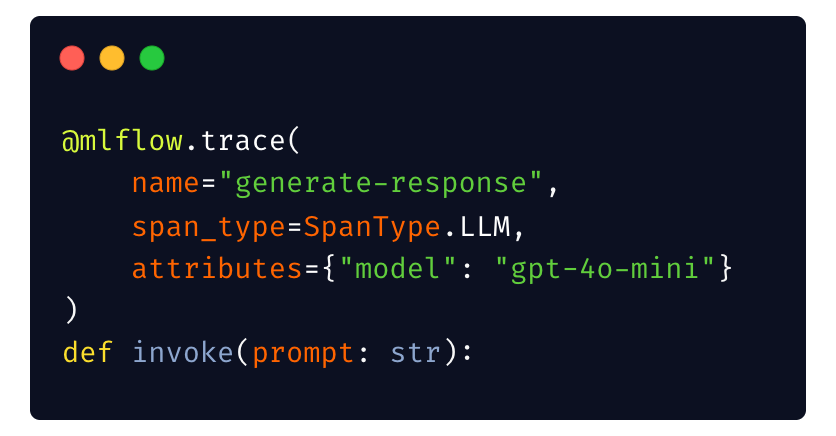
Automatic Tracing
Instrument your application with a single line of code. We recommend starting from here.
Manual Tracing
Instrument any Python code with a few lines of code, with full control and flexibility.
Typescript SDK
Instrument your Node.js applications with MLflow Tracing Typescript SDK.
OpenTelemetry
When you are using OpenTelemetry as your observability platform, you can export traces to MLflow directly.
3. Choose Destination for Your Traces
MLflow Tracing supports exporting traces to various destinations.
MLflow Experiment
Export traces to MLflow Tracking Server hosted on your machine.
Databricks
Export traces to Databricks for centralized monitoring and governance.
OpenTelemetry
Export traces to any observability platform that supports OpenTelemetry protocol.
Common System Patterns
Production Considerations
MLflow Tracing is production ready, but in order to ensure the scalability and reliability of the tracing system, we recommend the following best practices:
- Enable Async Logging and set up appropriate queue size and timeout.
- Use the lightweight
mlflow-tracingpackage for minimizing the package footprint and dependencies. - Use managed MLflow services for reducing the operational overhead and ensure the scalability of the tracing system.
- When using self-hosted MLflow, make sure to use the SQL Backend with a scalable database like PostgreSQL. The default file-based backend has scalability limitations and is not recommended for production use.
Async Applications
Async programming is an effective tool for improving the throughput of your application, particularly for LLM-based applications that are typically I/O bound. MLflow Tracing natively supports instrumenting async applications.
Multi-Threaded Applications
Multi-threading is a common strategy for parallelizing IO-bound operations in applications. MLflow Tracing supports multi-threaded applications using context propagation.
Managing User sessions
Many LLM-based applications are deployed as chat-based applications, where each user session is a separate thread. Grouping traces by user session is a common practice. MLflow Tracing supports managing user sessions.
Redacting PII Data
Traces can contain sensitive data such as raw user inputs, internal document contents, etc. MLflow Tracing supports redacting PII data using flexible masking rules, custom functions, and integration with external PII masking libraries.
Collecting User Feedbacks
User feedback is a valuable source of information for improving the user experience of your application. MLflow Tracing supports collecting user feedback on traces to track and analyze the feedbacks effectively.