Tracing with OpenTelemetry
OpenTelemetry is a CNCF-backed project that provides vendor-neutral observability APIs and SDKs to collect telemetry data from your applications. MLflow Tracing is fully compatible with OpenTelemetry, making it free from vendor lock-in.
Using the MLflow Tracing SDK
The MLflow Tracing SDK is built on top of the OpenTelemetry SDK. If you want to instrument your AI applications with minimal effort, use the MLflow Tracing SDK.
import mlflow
from openai import OpenAI

mlflow.openai.autolog()

client = OpenAI()
response = client.responses.create(model="gpt-4o-mini", input="Hello, world!")
Using Other OpenTelemetry Libraries
You may want to trace LLMs or frameworks that are not supported by the MLflow Tracing SDK, or instrument applications written in languages other than Python and TypeScript/JavaScript.
MLflow Server exposes an OTLP endpoint at /v1/traces (OTLP) that accepts traces from any OpenTelemetry instrumentation, allowing you to trace applications written in other languages such as Java, Go, Rust, etc. To export traces to MLflow, set OTEL_EXPORTER_OTLP_TRACES_ENDPOINT to the MLflow server endpoint and set the x-mlflow-experiment-id header to the MLflow experiment ID.
export OTEL_EXPORTER_OTLP_TRACES_ENDPOINT=http://localhost:5000/v1/traces
export OTEL_EXPORTER_OTLP_TRACES_HEADERS=x-mlflow-experiment-id=123
For more details about the MLflow OpenTelemetry integration, see Collect OpenTelemetry Traces into MLflow.
Combining the OpenTelemetry SDK and the MLflow Tracing SDK
Since the MLflow Tracing SDK is built on top of the OpenTelemetry SDK, you can combine them to get the best of both worlds. To use both SDKs in a single application, set the MLFLOW_USE_DEFAULT_TRACER_PROVIDER environment variable to false. Then, you should invoke mlflow.tracing.set_destination() to add MLflow's span processors to the existing trace provider, ensuring spans from both OpenTelemetry and MLflow to be combined into a single trace.
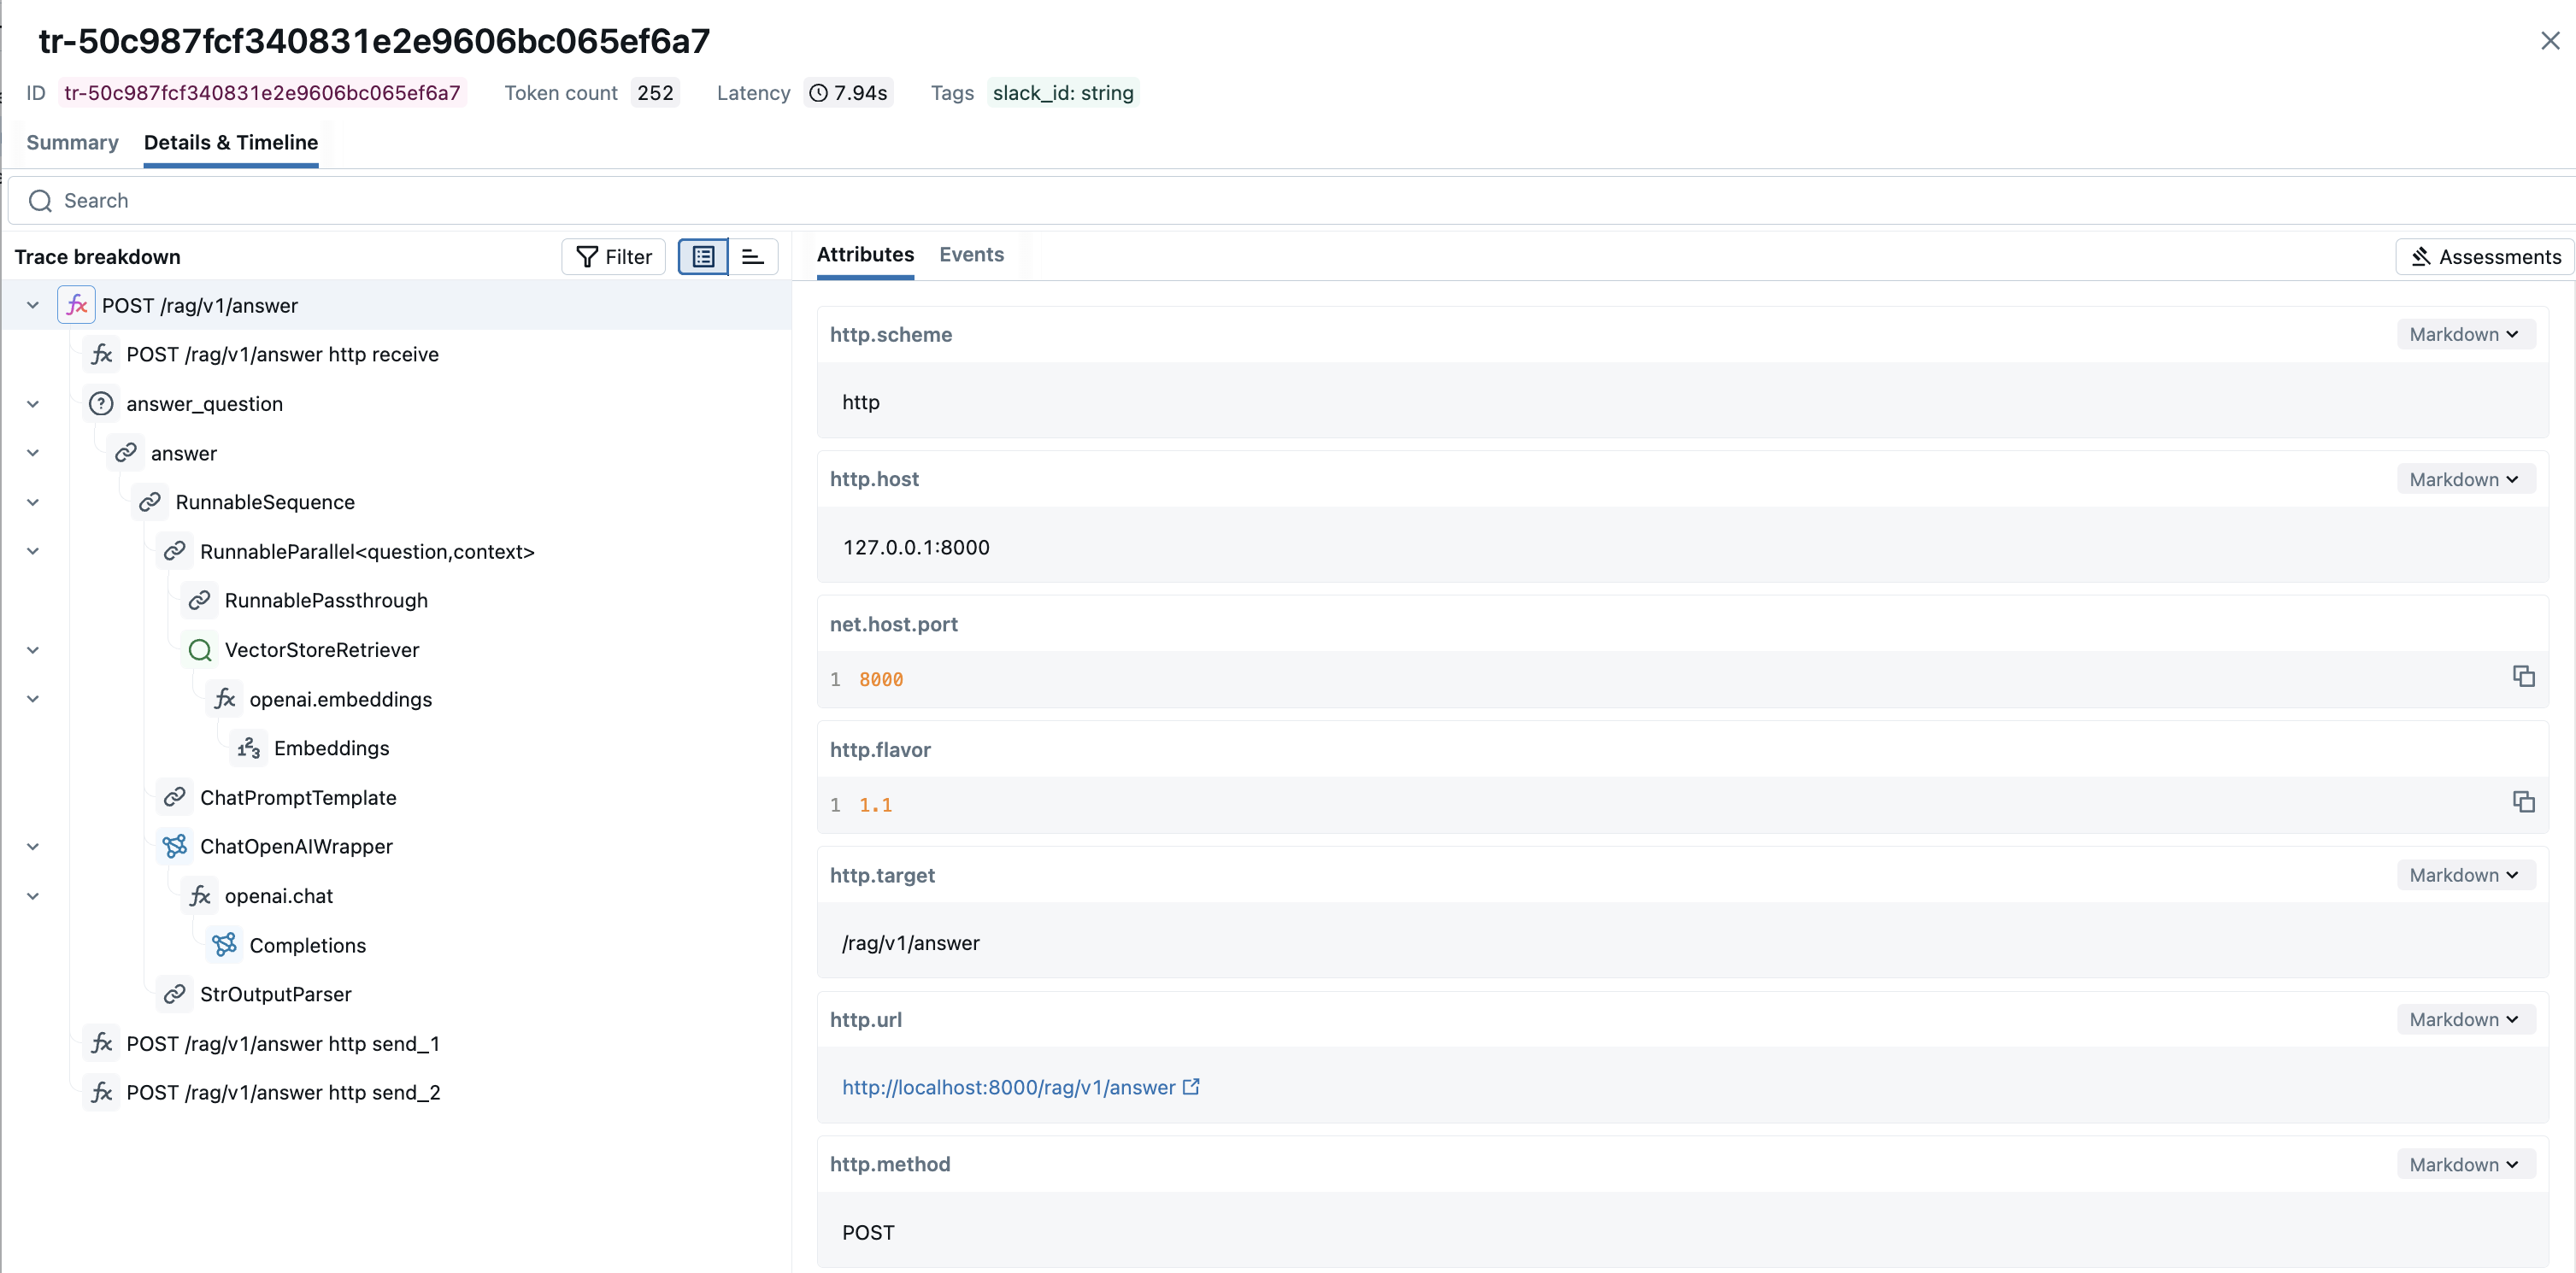
The following example shows how to combine MLflow's OpenAI auto-tracing with OpenTelemetry's native FastAPI instrumentation.
import os
import mlflow
from mlflow.entities.trace_location import MlflowExperimentLocation
from contextlib import asynccontextmanager
from fastapi import FastAPI, Request, Response
from openai import OpenAI
from opentelemetry.instrumentation.fastapi import FastAPIInstrumentor

# Use the OpenTelemetry tracer provider instead of MLflow's default tracer provider.
os.environ["MLFLOW_USE_DEFAULT_TRACER_PROVIDER"] = "false"


# Enable MLflow OpenAI auto-tracing at application startup.
@asynccontextmanager
async def lifespan(app: FastAPI):
    mlflow.set_tracking_uri("http://localhost:5000")
    exp_id = mlflow.set_experiment("FastAPI").experiment_id
    # this ensures mlflow spans and FastAPI instrumentation spans are combined
    mlflow.tracing.set_destination(MlflowExperimentLocation(exp_id))
    mlflow.openai.autolog()
    yield


app = FastAPI(lifespan=lifespan)
# Enable FastAPI auto-instrumentation, which creates an OpenTelemetry span for each endpoint call.
FastAPIInstrumentor.instrument_app(app)


@app.post("/rag/v1/answer")
@mlflow.trace
async def answer_question(query: Request) -> Response:
    return ...
Spans generated from both SDKs will be merged into a single trace.
Setting Up TraceProvider By Yourself
You can explicitly configure your own TracerProvider (for example, to add custom processors or exporters). Setting MLFLOW_USE_DEFAULT_TRACER_PROVIDER to false and calling mlflow.tracing.set_destination() ensures MLflow and OpenTelemetry spans are combined into a single trace.
mlflow.tracing.set_destination() must be invoked after you explicitly configured the trace provider.
import os
import mlflow
from mlflow.entities.trace_location import MlflowExperimentLocation
from opentelemetry import trace as otel_trace
from opentelemetry.sdk.trace import TracerProvider
# Use the OpenTelemetry tracer provider instead of MLflow's default tracer provider.
os.environ["MLFLOW_USE_DEFAULT_TRACER_PROVIDER"] = "false"
# Set up the MLflow experiment
mlflow.set_tracking_uri("http://localhost:5000")
experiment_id = mlflow.set_experiment("my_experiment").experiment_id
# Create and set your own TracerProvider
external_provider = TracerProvider()
otel_trace.set_tracer_provider(external_provider)
# Set MLflow tracing destination to the experiment (or UC schema), this ensures mlflow
# span processors are added to the tracer provider
mlflow.tracing.set_destination(MlflowExperimentLocation(experiment_id))
# Now you can use both OpenTelemetry and MLflow tracing together
otel_tracer = otel_trace.get_tracer("my_app")
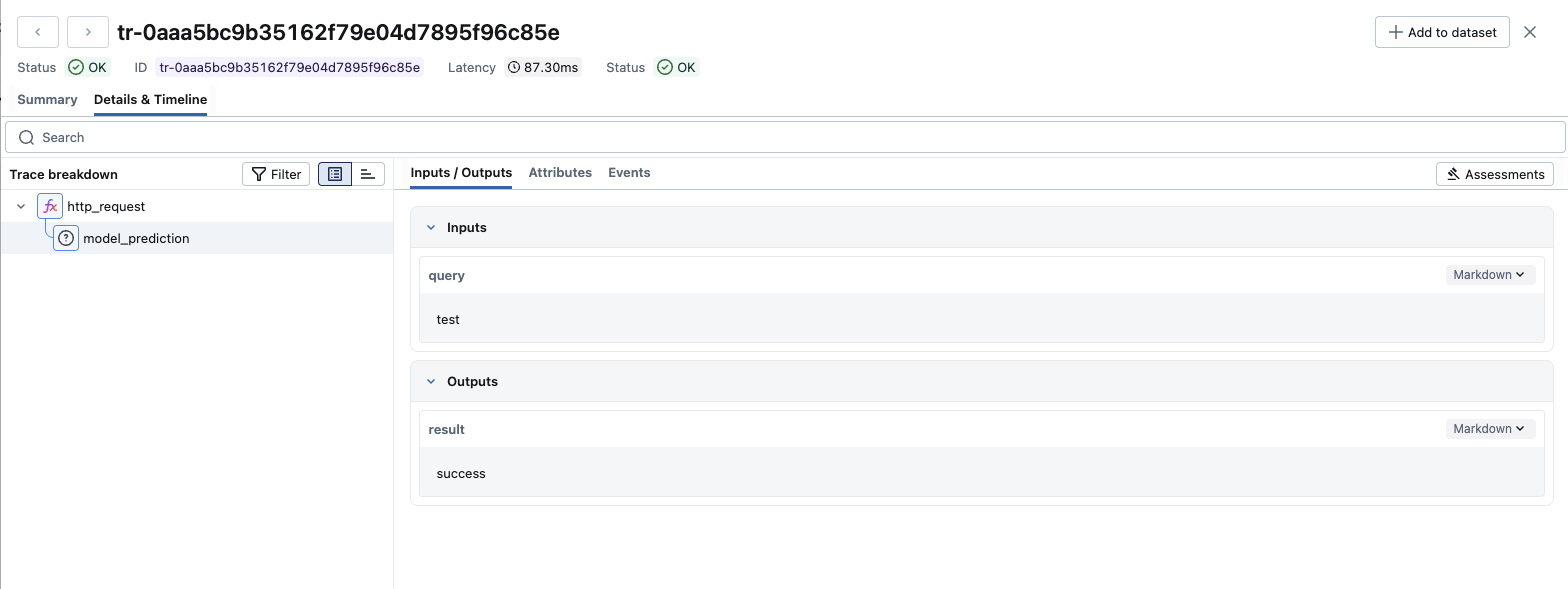
with otel_tracer.start_as_current_span("http_request") as external_span:
external_span.set_attribute("http.method", "GET")
# MLflow spans will be nested under the OpenTelemetry span
with mlflow.start_span("model_prediction") as mlflow_span:
mlflow_span.set_inputs({"query": "test"})
mlflow_span.set_outputs({"result": "success"})
Both the OpenTelemetry span (http_request) and the MLflow span (model_prediction) will appear in the same trace in the MLflow UI.