Trace Concepts
What is Tracing?
Tracing is an observability technique that captures the complete execution flow of a request through your application. Unlike traditional logging that captures discrete events, tracing creates a detailed map of how data flows through your system, recording every operation, transformation, and decision point.
In the context of GenAI applications, tracing becomes essential because these systems involve complex, multi-step workflows that are difficult to debug and optimize without complete visibility into their execution.
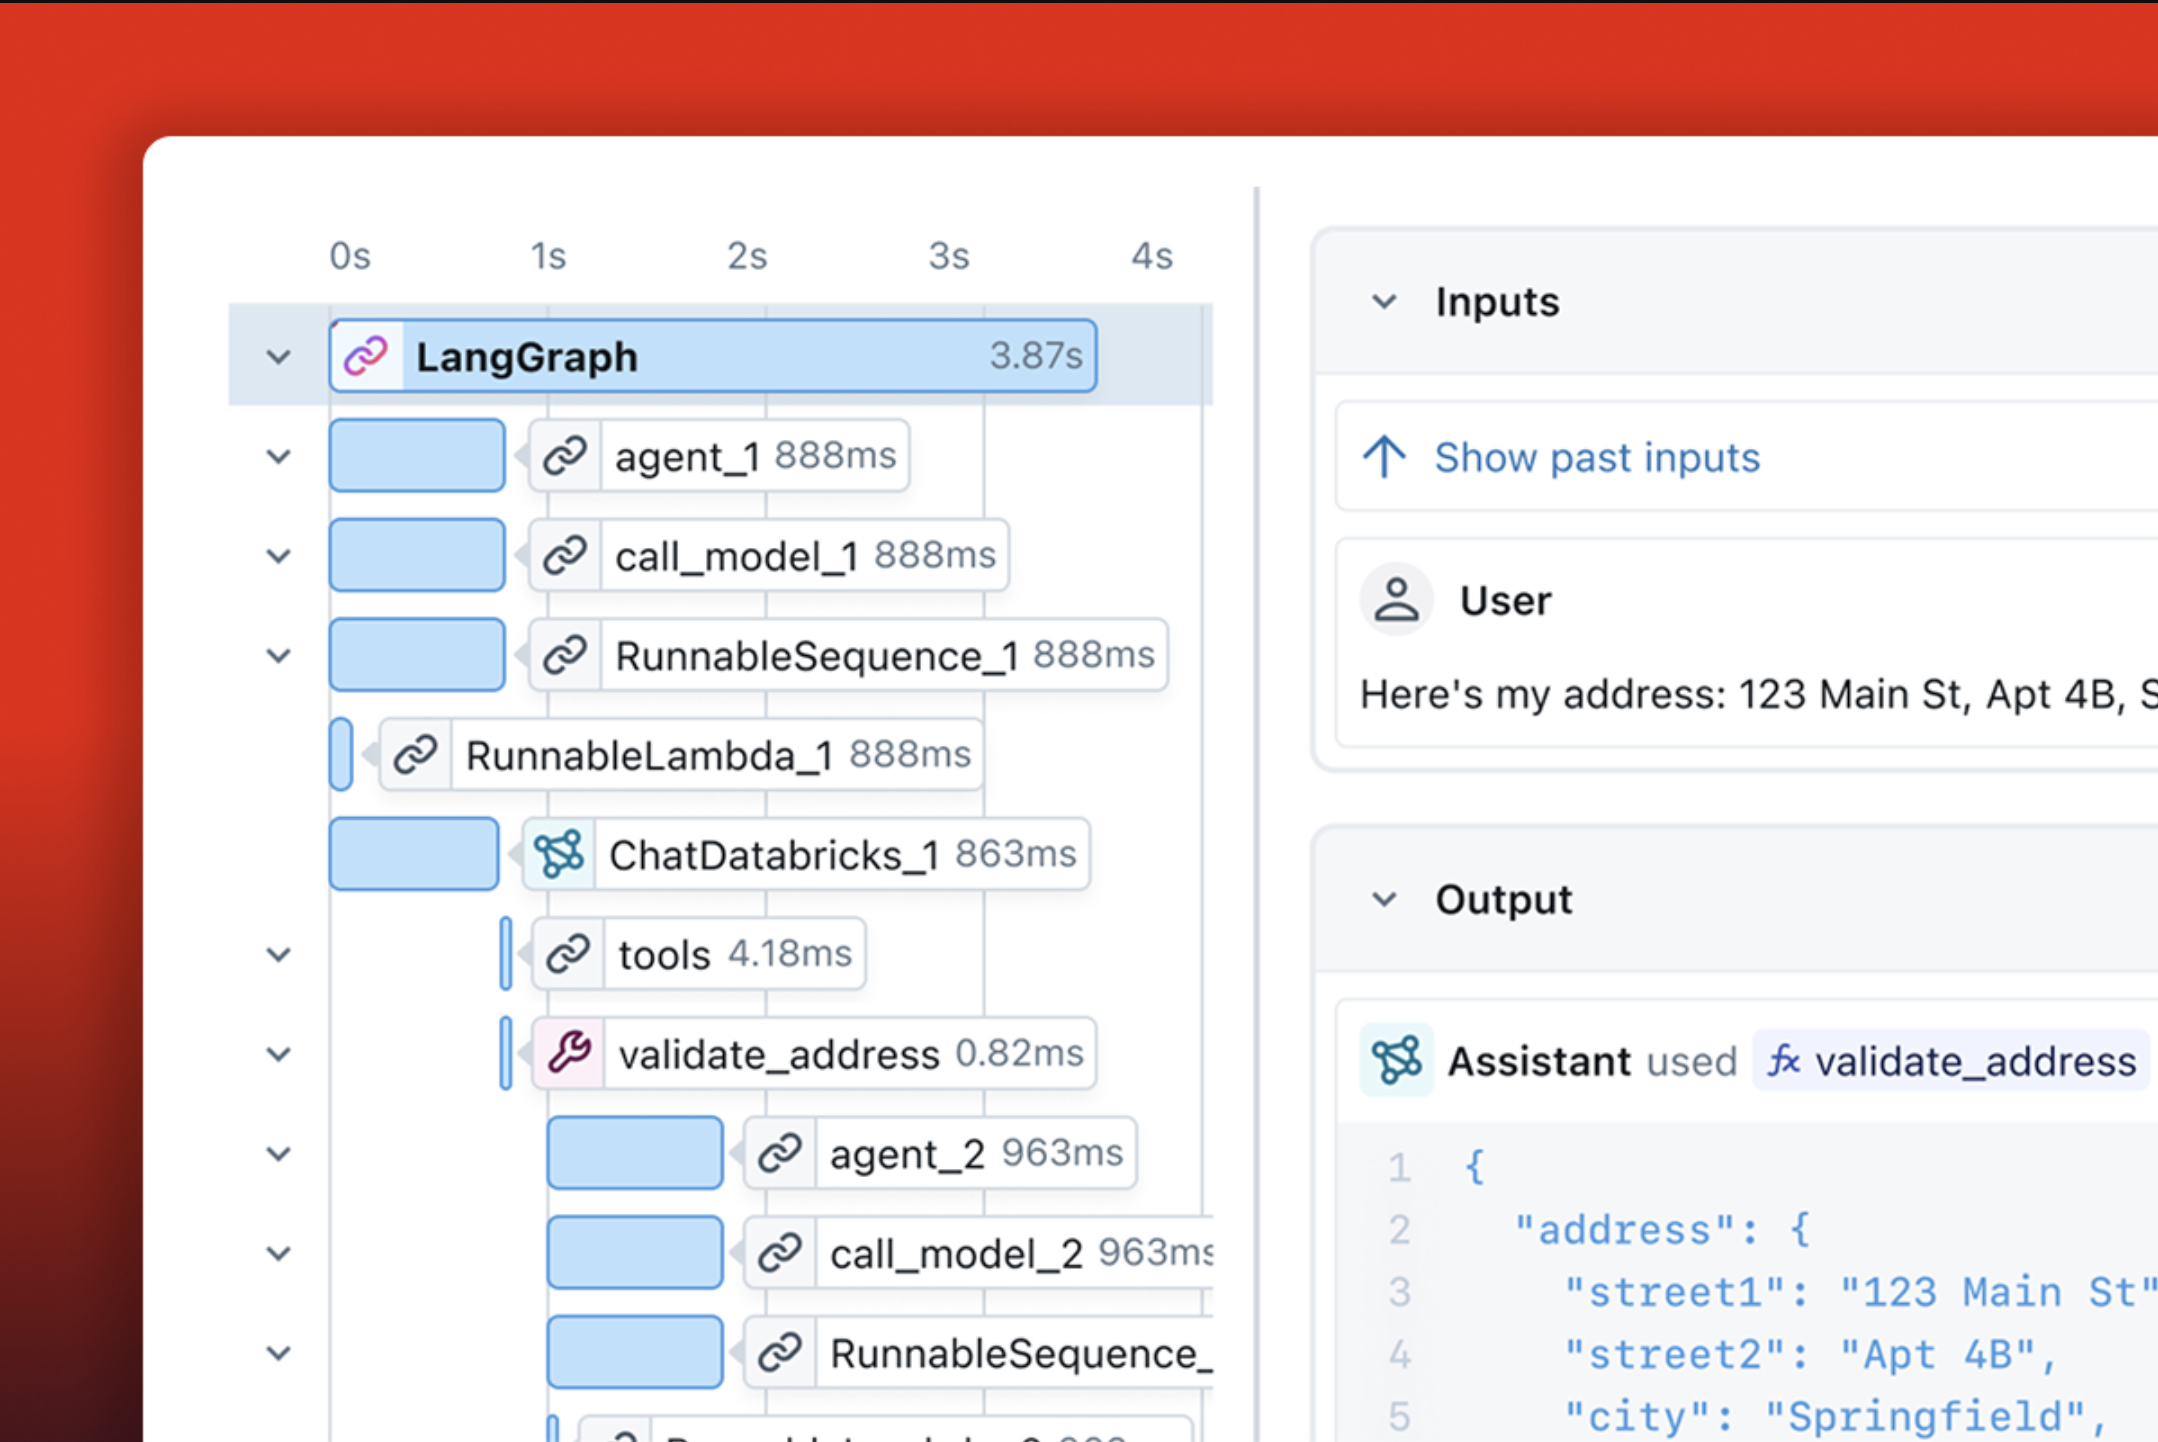
Example of a Trace for a Tool Calling Agent
Use Cases
Debugging
Tracing provides deep insights into what happens beneath the abstractions of GenAI libraries, helping you precisely identify where issues occur.
Quality Checks
Traces provides a unified way to track the quality of the output. You can manually review the output recorded on traces and attach feedbacks to your traces to indicate the quality of the output.
Production Monitoring
Traces captures key metrics like latency and token usage at each step, helping you identify bottlenecks, monitor efficiency, and find optimization opportunities.
Dataset Collection
Traces from production systems capture perfect data for building high-quality datasets with precise details for internal components like retrievers and tools.
Core Structure
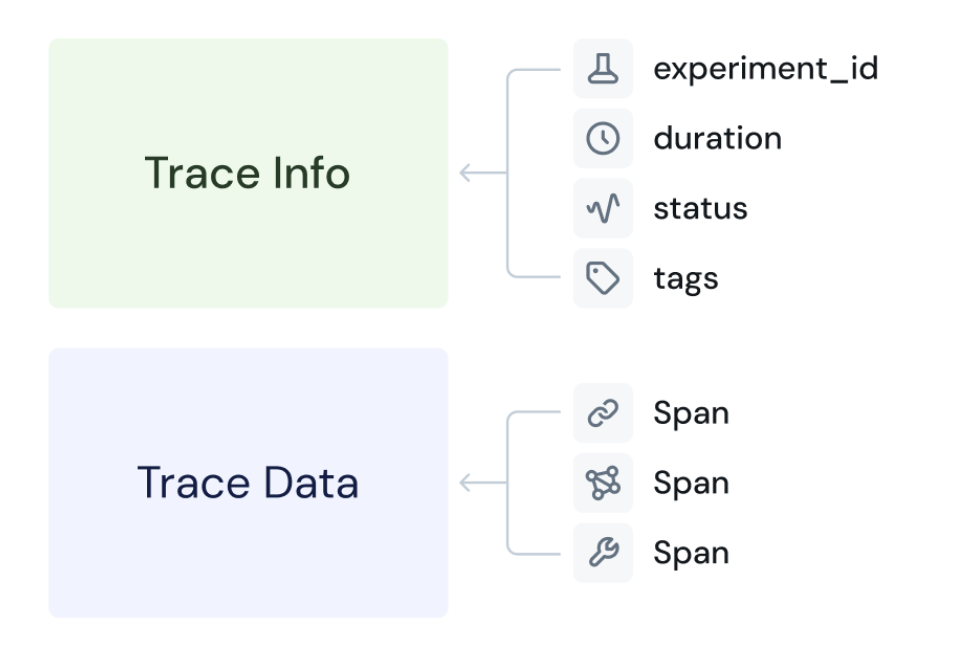
At a high level, an MLflow Trace is composed of two primary objects:
TraceInfo: Metadata that aids in explaining the origination of the trace, the status of the trace, information about the total execution time, etc. This includes tags that provide additional context for the trace, such as the user, session, and developer-provided key:value pairs. Tags can be used for searching or filtering traces.
TraceData: The actual payload, which contains the instrumented Span objects that capture your application's step-by-step execution from input to output.
MLflow Trace Architecture Overview
MLflow Traces are designed to be compatible with OpenTelemetry specifications, a widely adopted industry standard for observability. This ensures interoperability and allows MLflow Traces to be exported and used with other OpenTelemetry-compatible systems. MLflow enhances the basic OpenTelemetry Span model by defining specific structures and attributes for Generative AI use cases, providing richer context and deeper insight into quality and performance.
TraceInfo: Metadata and Context
The TraceInfo within MLflow's tracing feature aims to provide a lightweight snapshot of critical data about the overall trace. In Python SDK, TraceInfo is designed as a dataclass object that contains metadata about the trace.
This metadata includes information about the trace's origin, status, and various other data that aids in retrieving and filtering traces when used with mlflow.search_traces() and for navigation of traces within the MLflow UI.
| Field | Type | Description |
|---|---|---|
trace_id | str | The primary identifier for the trace. |
trace_location | TraceLocation | The location where the trace is stored, represented as a TraceLocation object. MLflow currently supports MLflow Experiment as a trace location. |
request_time | int | Start time of the trace, in milliseconds. |
state | TraceState | State of the trace, represented as a TraceState enum. Can be one of OK, ERROR, IN_PROGRESS, STATE_UNSPECIFIED. |
execution_duration | int | Duration of the trace, in milliseconds. |
request_preview | Optional[str] | Request to the model/agent, equivalent to the input of the root span but JSON-encoded and can be truncated. |
response_preview | Optional[str] | Response from the model/agent, equivalent to the output of the root span but JSON-encoded and can be truncated. |
client_request_id | Optional[str] | Client supplied request ID associated with the trace. This could be used to identify the trace/request from an external system that produced the trace, e.g., a session ID in a web application. |
trace_metadata | dict[str, str] | Key-value pairs associated with the trace. They are designed for immutable values like run ID associated with the trace. |
tags | dict[str, str] | Tags are key-value pairs that can be used to annotate the trace. They are designed for mutable values, that can be updated after the trace is created via MLflow UI or API, and are useful for grouping traces and efficiently querying them. Visit Setting Trace Tags for more details about the usage of tags. |
TraceData: Container of Spans
The MLflow TraceData object, accessible via trace.data, is a container of Span object. This is where the actual execution details are stored, including the request and response data, latency of each step, input and output messages to LLMs, retrieved documents from vector stores, tool call parameters, etc.
Spans in a trace forms a hierarchy through parent-child connections. Each span details a specific unit of work.
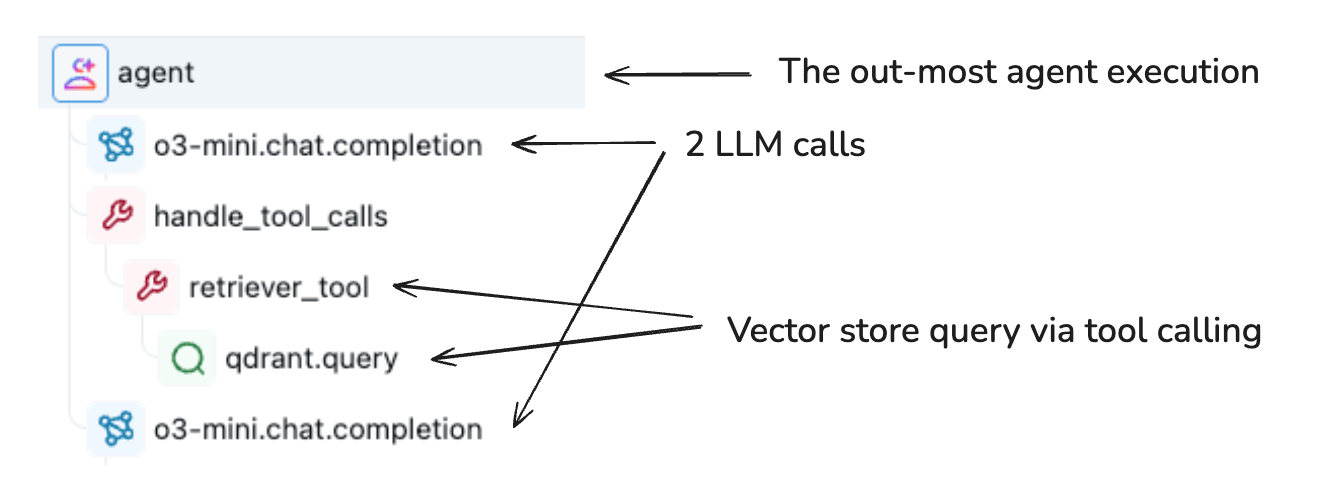
For example, the following picture illustrates a set of spans that are organized in a tree structure in a trace. Each line represents a span, where the tree-structure is formed by the curly edges between lines. For example, the root span is "agent", which links to three children spans: 2 LLm calls and 1 tool handling.
To learn more about the span object and its schema, continue to the Span Concepts page.
Storage Layout
TraceInfo is a lightweight metadata object, hence can be stored directly in a relational database. For example, if you are running MLflow Tracking Server on SQL database such as PostgreSQL, TraceInfo is stored as a single row in the trace table and support efficient query with indexes. For example, the data that is contained in the TraceInfo object is used to populate the trace view page within the MLflow tracking UI.
TraceData (Spans) are relatively large objects compared to TraceInfo, because it contains rich information about each execution step, such as the full message history input to an LLM call. Therefore, MLflow stores them in artifact storage rather than in the database. This allows you to handle large number of traces with cheaper costs and minimum impact to the performance of typical filtering and grouping operations for traces.