Tracing Claude Code
MLflow Tracing provides automatic tracing for Claude Code:
- CLI tracing: Automatically trace interactive Claude Code CLI conversations
- SDK tracing: Trace Claude Agent SDK usage in Python applications
After setting up auto tracing, MLflow will automatically capture traces of your Claude Code conversations and log them to the active MLflow experiment. The trace automatically captures information such as:
- User prompts and assistant responses
- Tool usage (file operations, code execution, web searches, etc.)
- Conversation timing and duration
- Tool execution results
- Token usage (input, output, and total tokens)
- Session metadata including working directory and user
Setup
Claude Code tracing can be configured using either CLI commands (for interactive use) or Python SDK imports (for programmatic use).
- CLI Tracing
- SDK Tracing
CLI Tracing Setup
Use CLI tracing to automatically capture your interactive Claude Code CLI conversations.
Requirements
- MLflow >= 3.4 (
pip install 'mlflow[genai]>=3.4') - Claude Code CLI installed and configured
Basic Setup
# Set up tracing in current directory
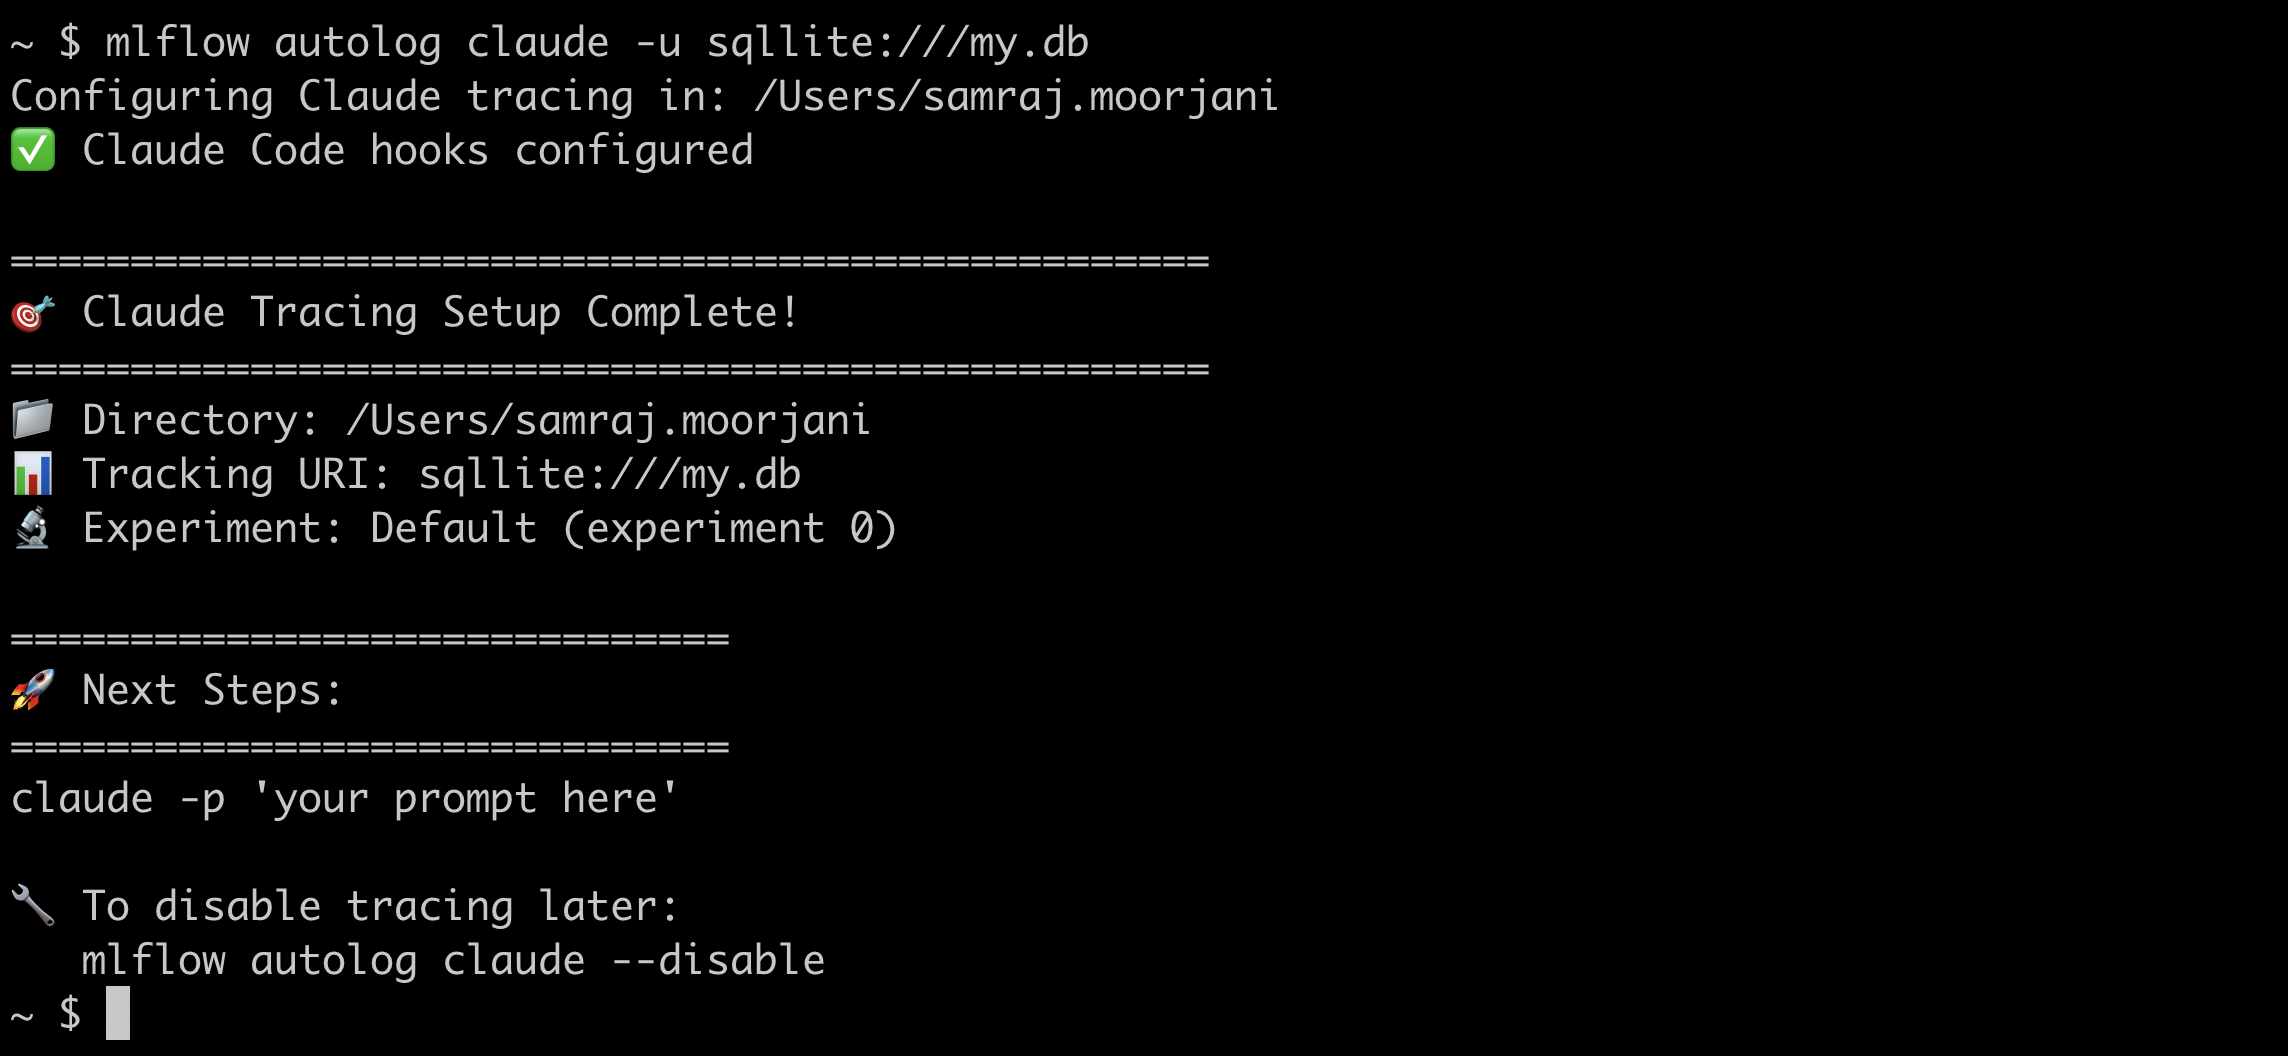
mlflow autolog claude
# Set up tracing in specific directory
mlflow autolog claude ~/my-project
# Check tracing status
mlflow autolog claude --status
# Disable tracing
mlflow autolog claude --disable
Configuration Examples
# Set up with custom tracking URI
mlflow autolog claude -u file://./custom-mlruns
mlflow autolog claude -u sqlite:///mlflow.db

# Set up with Databricks backend and a specific experiment ID
mlflow autolog claude -u databricks -e 123456789

# Set up with specific experiment
mlflow autolog claude -n "My AI Project"
How It Works
- Setup Phase: The
mlflow autolog claudecommand configures Claude Code hooks in a.claude/settings.jsonfile in your project directory - Automatic Tracing: When you use the
claudecommand in the configured directory, your conversations are automatically traced - View Results: Use the MLflow UI to explore your traces
Basic Example
# Set up tracing in your project
mlflow autolog claude ~/my-project

# Navigate to project directory
cd ~/my-project

# Use Claude Code normally - tracing happens automatically
claude "help me refactor this Python function to be more efficient"

# View traces in MLflow UI
mlflow server
SDK Tracing Setup
Use SDK tracing when building applications that programmatically use the Claude Agent SDK.
Requirements
- MLflow >= 3.5 (
pip install 'mlflow[genai]>=3.5') - Claude Agent SDK >= 0.1.0 (
pip install claude-agent-sdk >= 0.1.0)
Basic Setup
import mlflow.anthropic

# Enable automatic tracing for Claude Agent SDK
mlflow.anthropic.autolog()
Once enabled, all Claude Agent SDK interactions will be automatically traced.
Only ClaudeSDKClient supports tracing. Directly calling query will not be traced!
Complete Example
import asyncio
import mlflow.anthropic
from claude_agent_sdk import ClaudeSDKClient

# Enable autologging
mlflow.anthropic.autolog()

# Optionally configure MLflow experiment
mlflow.set_experiment("my_claude_app")


async def main():
    async with ClaudeSDKClient() as client:
        await client.query("What is the capital of France?")

        async for message in client.receive_response():
            print(message)


if __name__ == "__main__":
    asyncio.run(main())
Claude Tracing with MLflow GenAI Evaluation
You can also use SDK tracing with MLflow's GenAI evaluation framework:
import asyncio
import pandas as pd
from claude_agent_sdk import ClaudeSDKClient
from typing import Literal

import mlflow.anthropic
from mlflow.genai import evaluate, scorer
from mlflow.genai.judges import make_judge

mlflow.anthropic.autolog()


async def run_agent(query: str) -> str:
    """Run Claude Agent SDK and return response"""
    async with ClaudeSDKClient() as client:
        await client.query(query)

        response_text = ""
        async for message in client.receive_response():
            response_text += str(message) + "\n\n"

        return response_text


def predict_fn(query: str) -> str:
    """Synchronous wrapper for evaluation"""
    return asyncio.run(run_agent(query))


relevance = make_judge(
    name="relevance",
    instructions=(
        "Evaluate if the response in {{ outputs }} is relevant to "
        "the question in {{ inputs }}. Return either 'pass' or 'fail'."
    ),
    feedback_value_type=Literal["pass", "fail"],
    model="openai:/gpt-4o",
)

# Create evaluation dataset
eval_data = pd.DataFrame(
    [
        {"inputs": {"query": "What is machine learning?"}},
        {"inputs": {"query": "Explain neural networks"}},
    ]
)

# Run evaluation with automatic tracing
mlflow.set_experiment("claude_evaluation")
evaluate(data=eval_data, predict_fn=predict_fn, scorers=[relevance])
Token Usage
MLflow automatically tracks the token usage for each LLM call within Claude Code conversations. The token usage for each LLM call is logged in the mlflow.chat.tokenUsage attribute. The total token usage throughout the trace is available in the token_usage field of the trace info object.
import mlflow

# Get a Claude Code trace by its trace ID
trace = mlflow.get_trace("<your-trace-id>")

# Print the total token usage
total_usage = trace.info.token_usage
if total_usage:
    print("== Total token usage: ==")
    print(f"  Input tokens: {total_usage['input_tokens']}")
    print(f"  Output tokens: {total_usage['output_tokens']}")
    print(f"  Total tokens: {total_usage['total_tokens']}")

# Print the token usage for each LLM call
print("\n== Detailed usage for each LLM call: ==")
for span in trace.data.spans:
    if usage := span.get_attribute("mlflow.chat.tokenUsage"):
        print(f"{span.name}:")
        print(f"  Input tokens: {usage['input_tokens']}")
        print(f"  Output tokens: {usage['output_tokens']}")
        print(f"  Total tokens: {usage['total_tokens']}")
== Total token usage: ==
  Input tokens: 1250
  Output tokens: 340
  Total tokens: 1590

== Detailed usage for each LLM call: ==
llm_call_1:
  Input tokens: 500
  Output tokens: 120
  Total tokens: 620
llm_call_2:
  Input tokens: 750
  Output tokens: 220
  Total tokens: 970
Troubleshooting
- CLI Tracing
- SDK Tracing
Check CLI Status
mlflow autolog claude --status
This shows:
- Whether tracing is enabled
- Current tracking URI
- Configured experiment
- Any configuration issues
Common CLI Issues
Tracing not working:
- Ensure you're in the configured directory
- Check that
.claude/settings.jsonexists - Review logs in
.claude/mlflow/claude_tracing.log
Missing traces:
- Check if
MLFLOW_CLAUDE_TRACING_ENABLED=truein your configuration - Verify the tracking URI is accessible
- Review logs in
.claude/mlflow/claude_tracing.log
Disable CLI Tracing
To stop automatic CLI tracing:
mlflow autolog claude --disable
This removes the hooks from .claude/settings.json but preserves existing traces.
Common SDK Issues
No traces appearing:
- Tracing only works with
ClaudeSDKClient- direct usage ofquery()is not supported - Verify
mlflow.anthropic.autolog()is called before creating theClaudeSDKClient - Check that the tracking URI and experiment ID are configured correctly
Disable SDK Tracing
To disable SDK tracing:
mlflow.anthropic.autolog(disable=True)