MLflow Tracing UI
GenAI Experiment Overview
The Overview tab in GenAI experiments provides comprehensive analytics and visualizations for your GenAI application traces. This tab is organized into three sub-tabs to help you monitor different aspects of your application.
All tabs include a time range selector and time unit selector to customize the granularity and range of the displayed data.
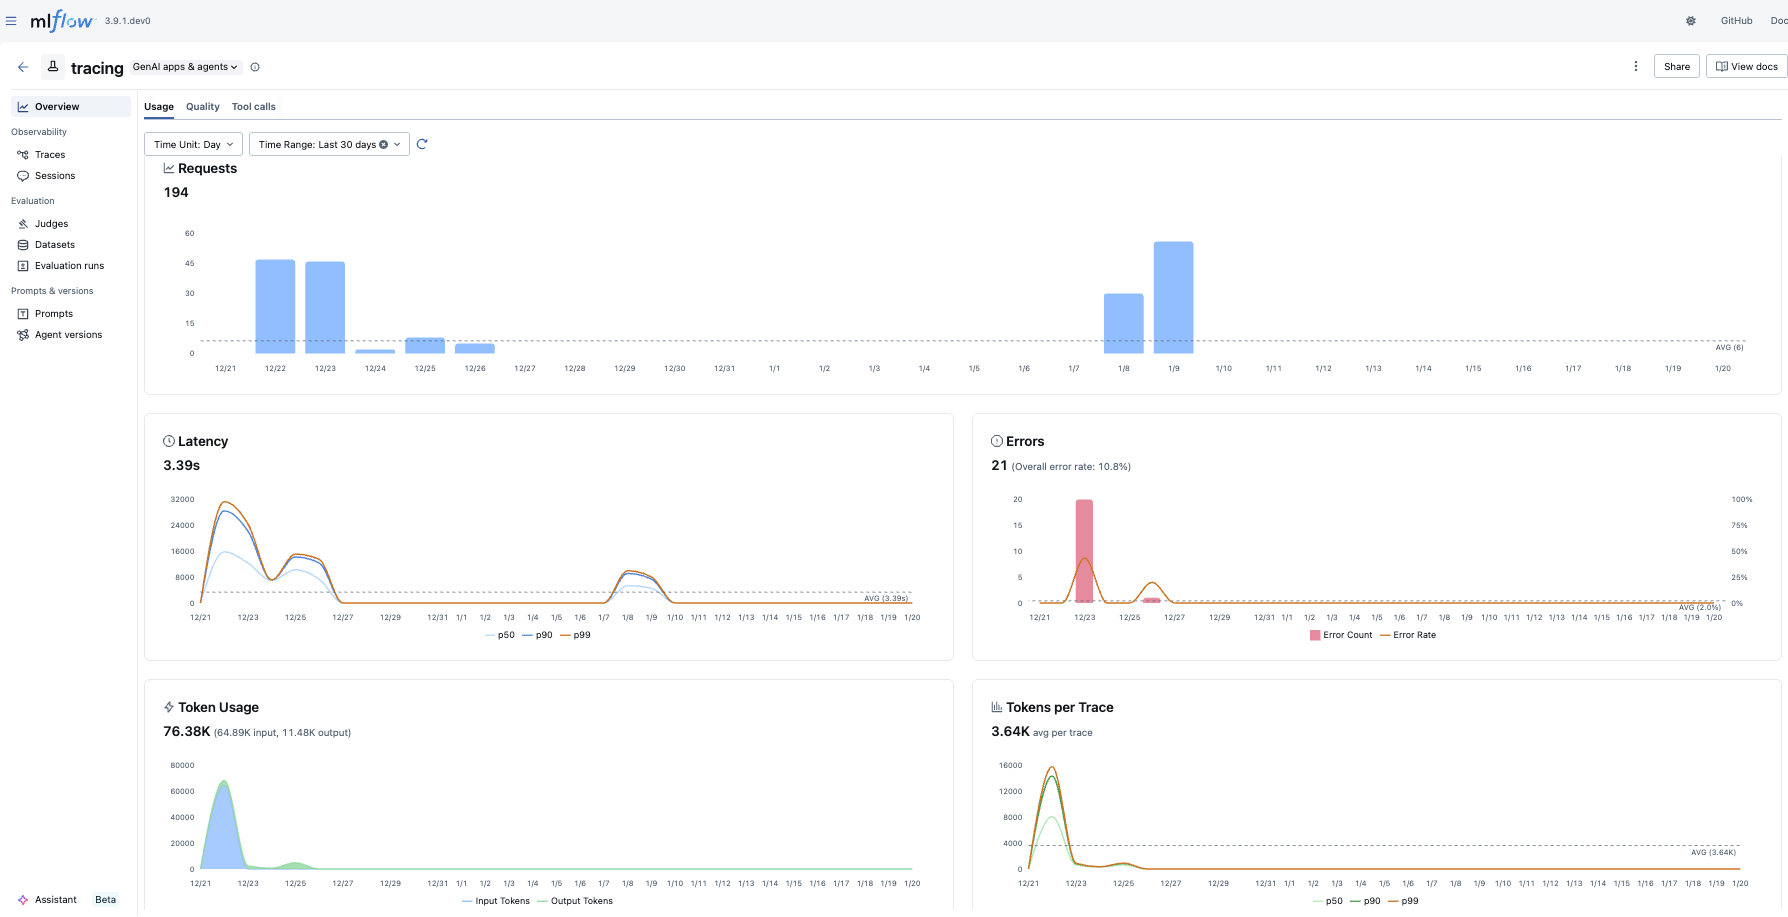
Usage
The Usage tab displays key metrics about your trace requests over time:
- Requests: Shows the total number of trace requests, with an average reference line
- Latency: Visualizes response time distribution to help identify performance bottlenecks
- Errors: Tracks error rates to quickly spot issues
- Token Usage & Token Stats: Monitors token consumption across your traces
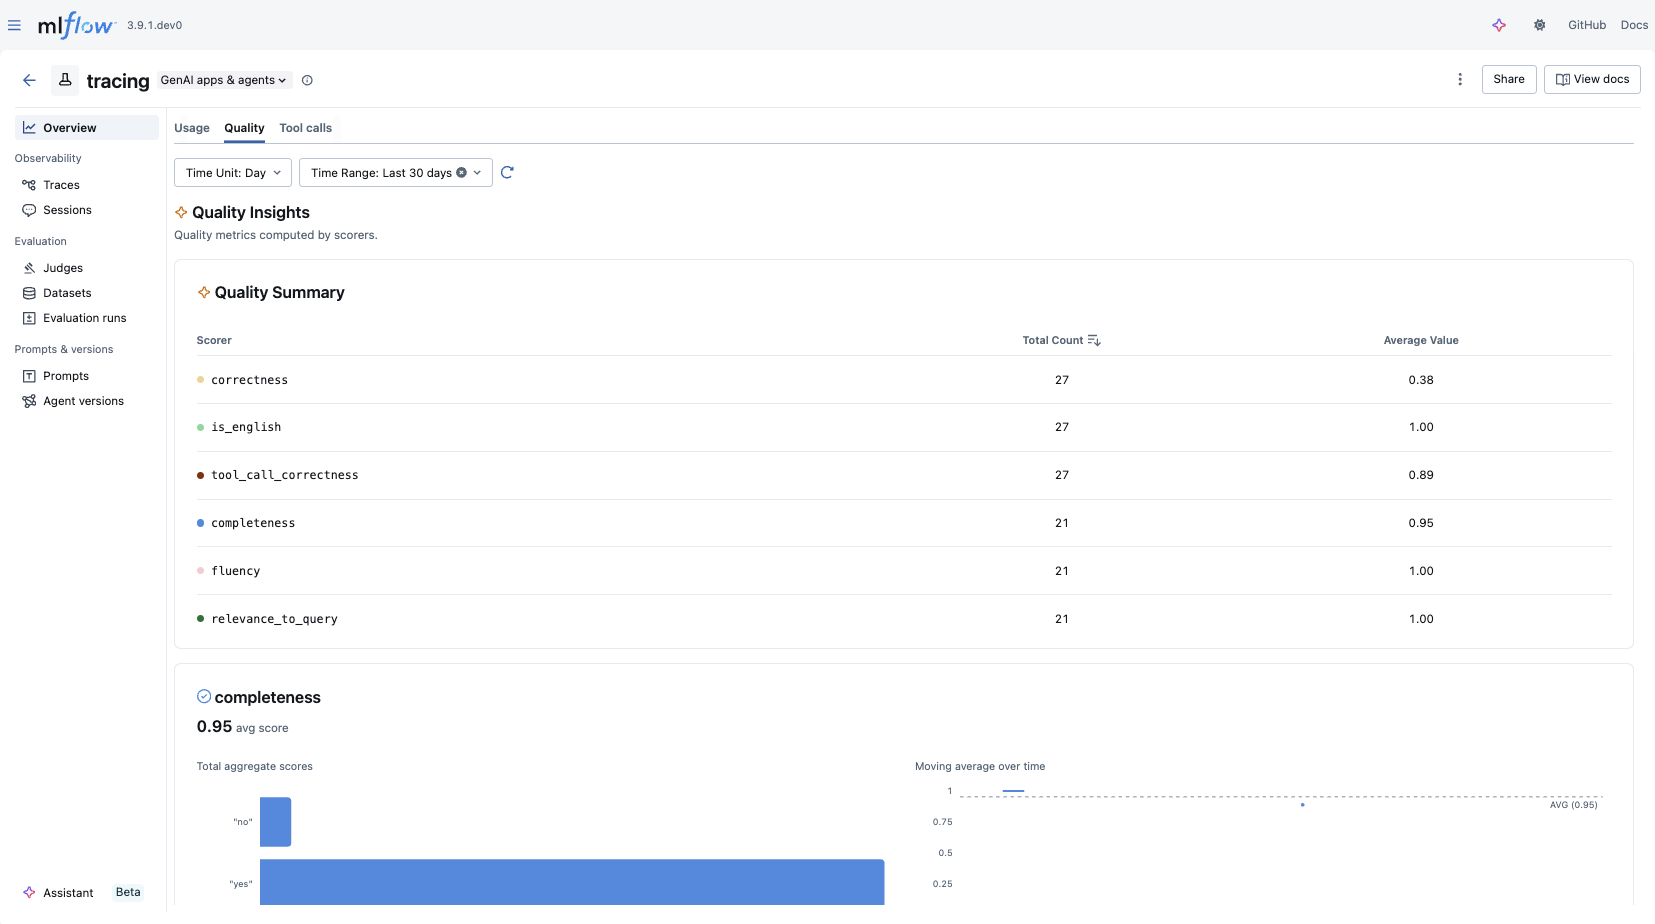
Quality
The Quality tab provides insights into the quality of your GenAI outputs:
- Quality Summary: Provides overview of scorers result
- Quality Insights: Displays metrics computed by scorers, with a dedicated chart for each assessment type
- Charts are dynamically generated based on the assessments available in your traces
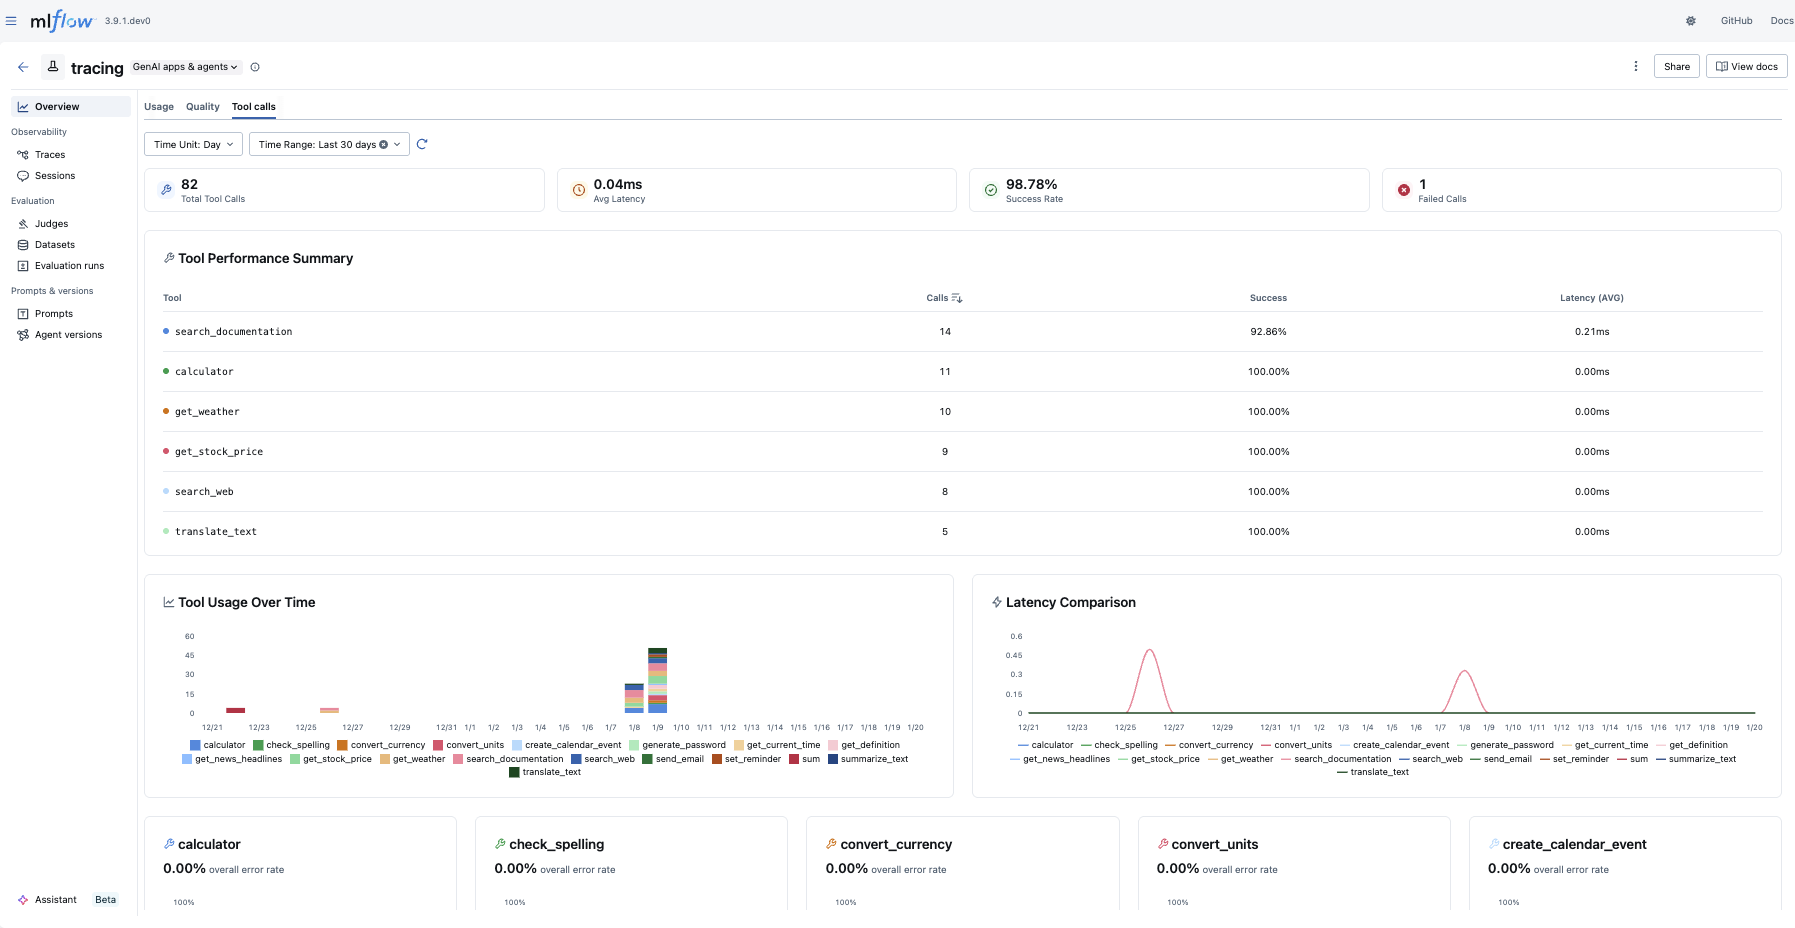
Tool Calls
The Tool Calls tab provides insights into agent tool usage:
- Statistics Cards: Shows at-a-glance metrics including total tool calls, average latency, success rate, and failed calls
- Tool Performance Summary: Provides an overview of how each tool is performing
- Tool Usage & Latency: Visualizes tool invocation patterns and response times
- Tool Error Rate: Tracks error rates per tool
Traces within MLflow Experiments
After logging your traces, you can view them in the MLflow UI, under the "Traces" tab in the main experiment page. This tab is also available within the individual run pages, if your trace was logged within a run context.
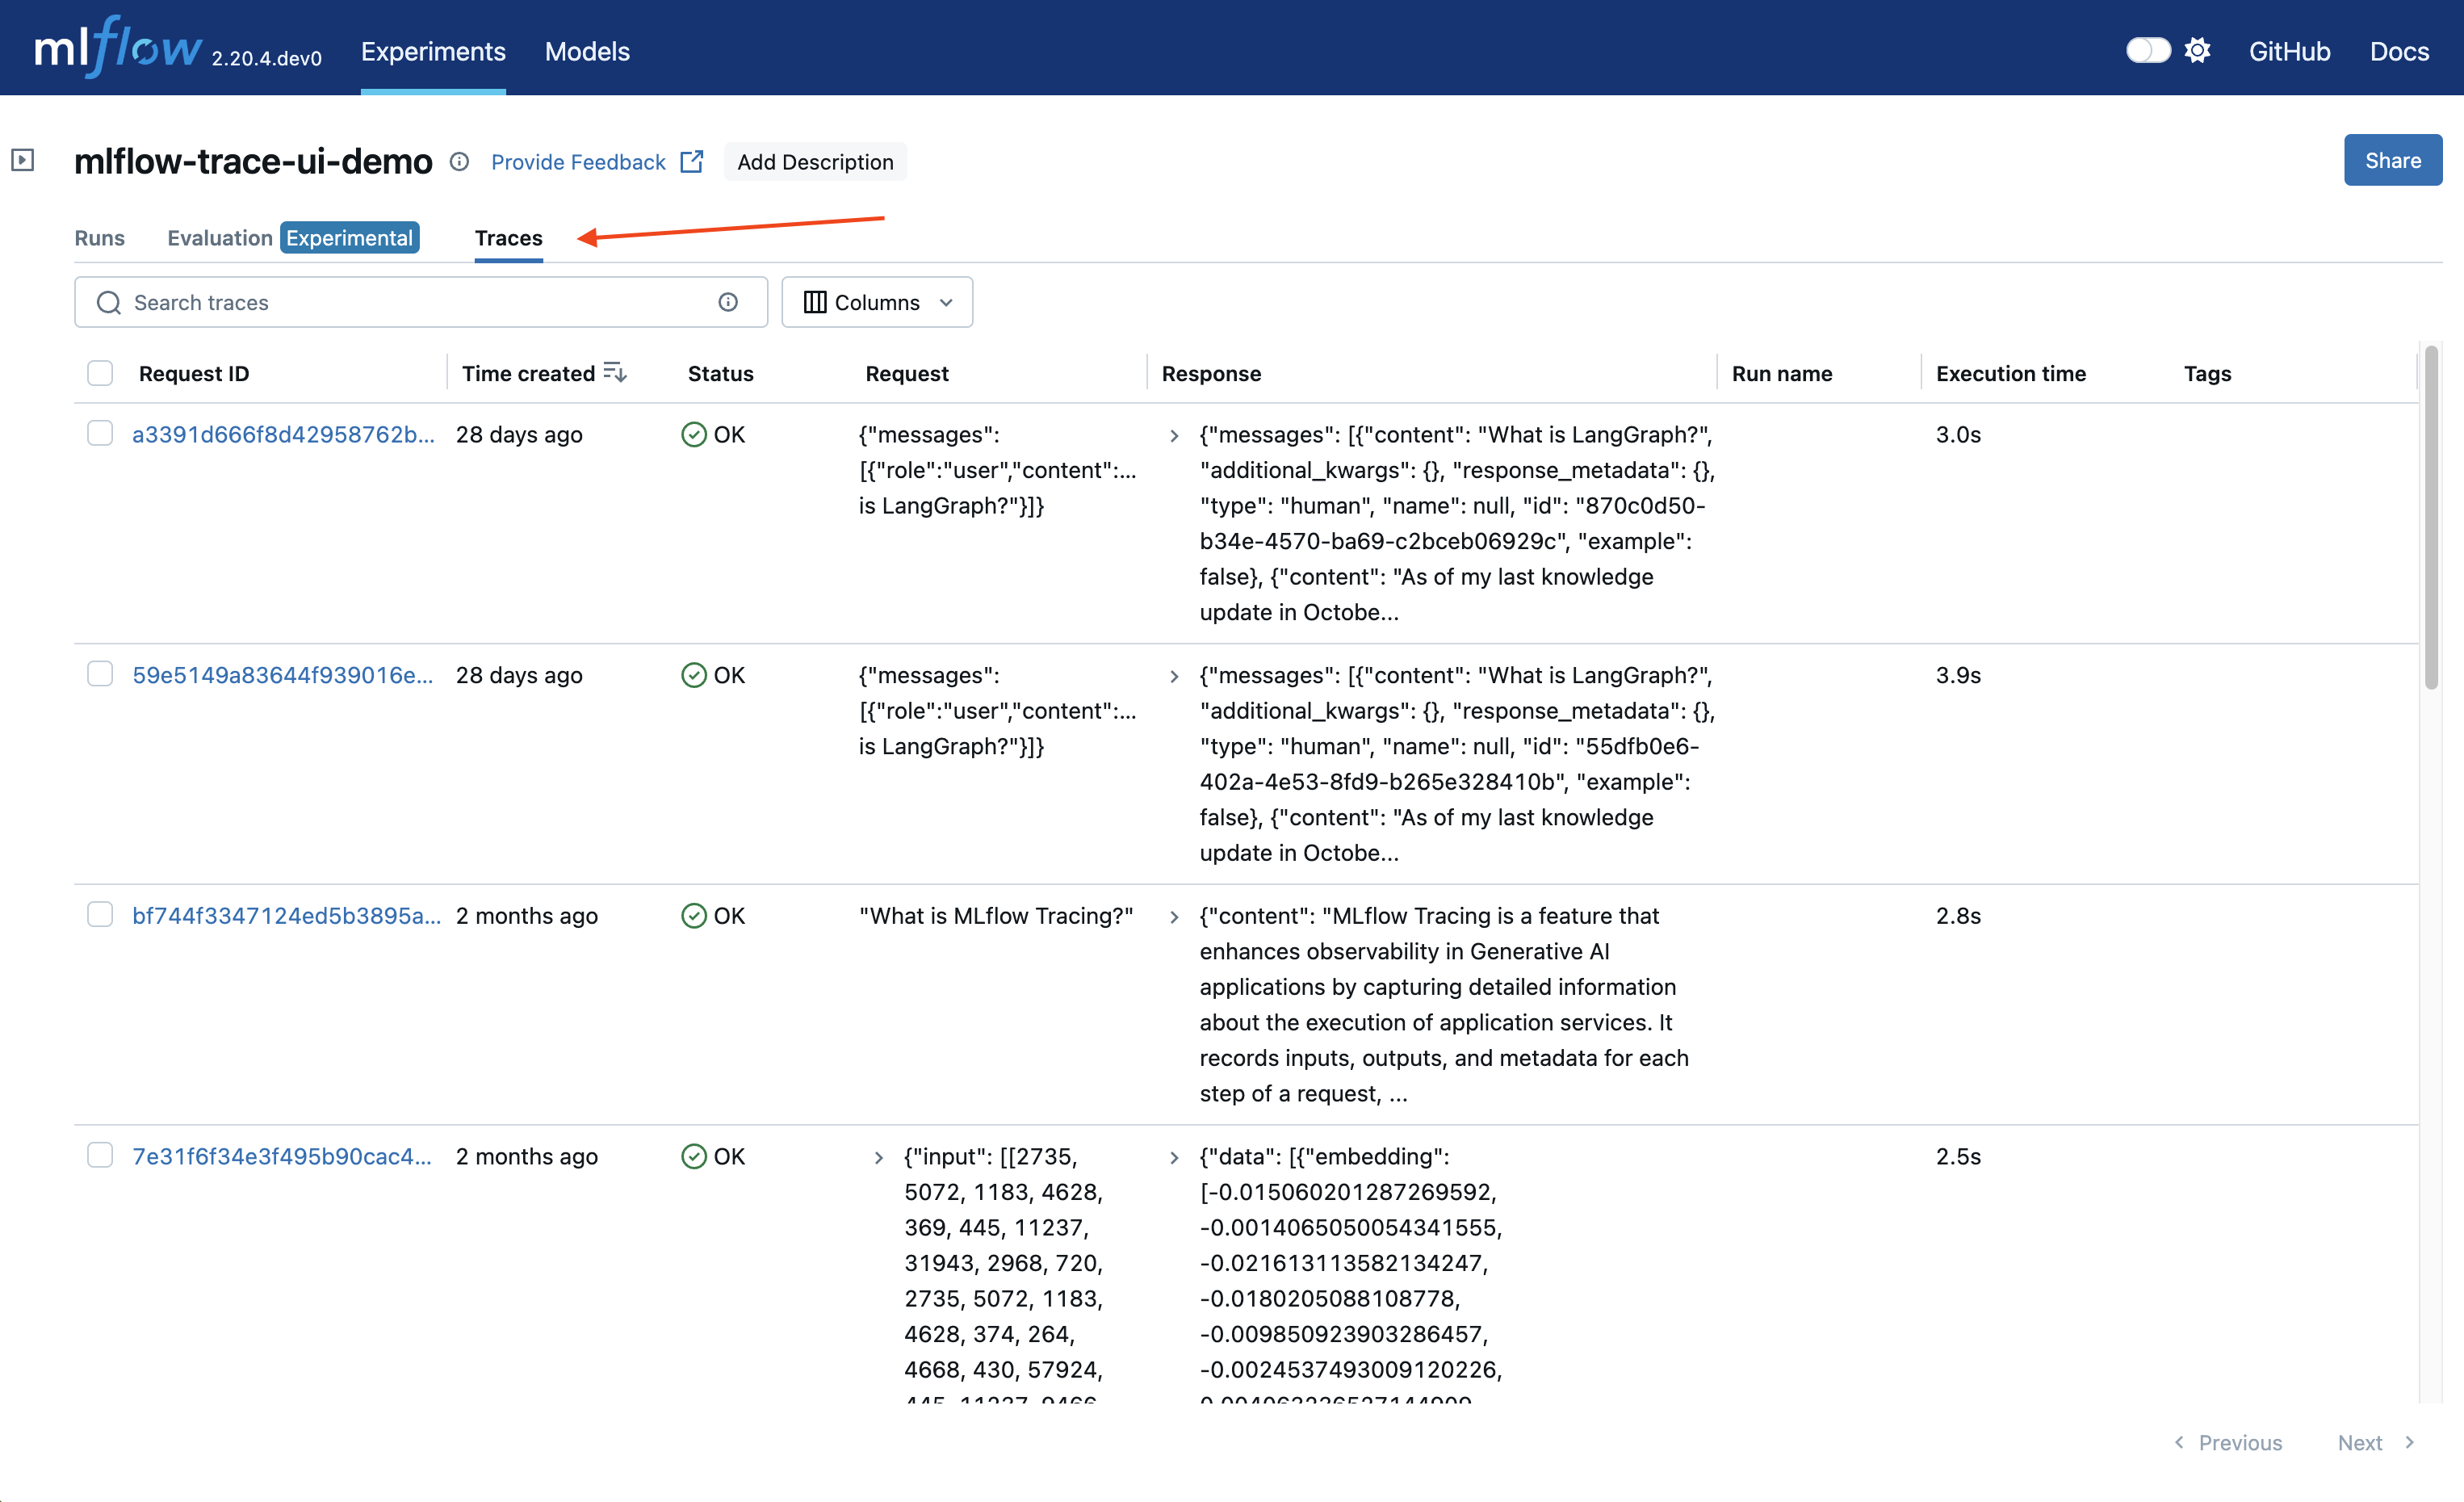
This table includes high-level information about the traces, such as the trace ID, the inputs / outputs of the root span, and more. From this page, you can also perform a few actions to manage your traces:
- Search
- Delete
- Edit Tags
Using the search bar in the UI, you can easily filter your traces based on name, tags, or other metadata. Check out the search docs for details about the query string format.
The UI supports bulk deletion of traces. Simply select the traces you want to delete by checking the checkboxes, and then pressing the "Delete" button.
You can also edit key-value tags on your traces via the UI.
Browsing span data
In order to browse the span data of an individual trace, simply click on the link in the "Trace ID" or "Trace name" columns to open the trace viewer:
Jupyter Notebook integration
The MLflow Tracing Jupyter integration is available in MLflow 2.20 and above
You can also view the trace UI directly within Jupyter notebooks, allowing you to debug your applications without having to tab out of your development environment.
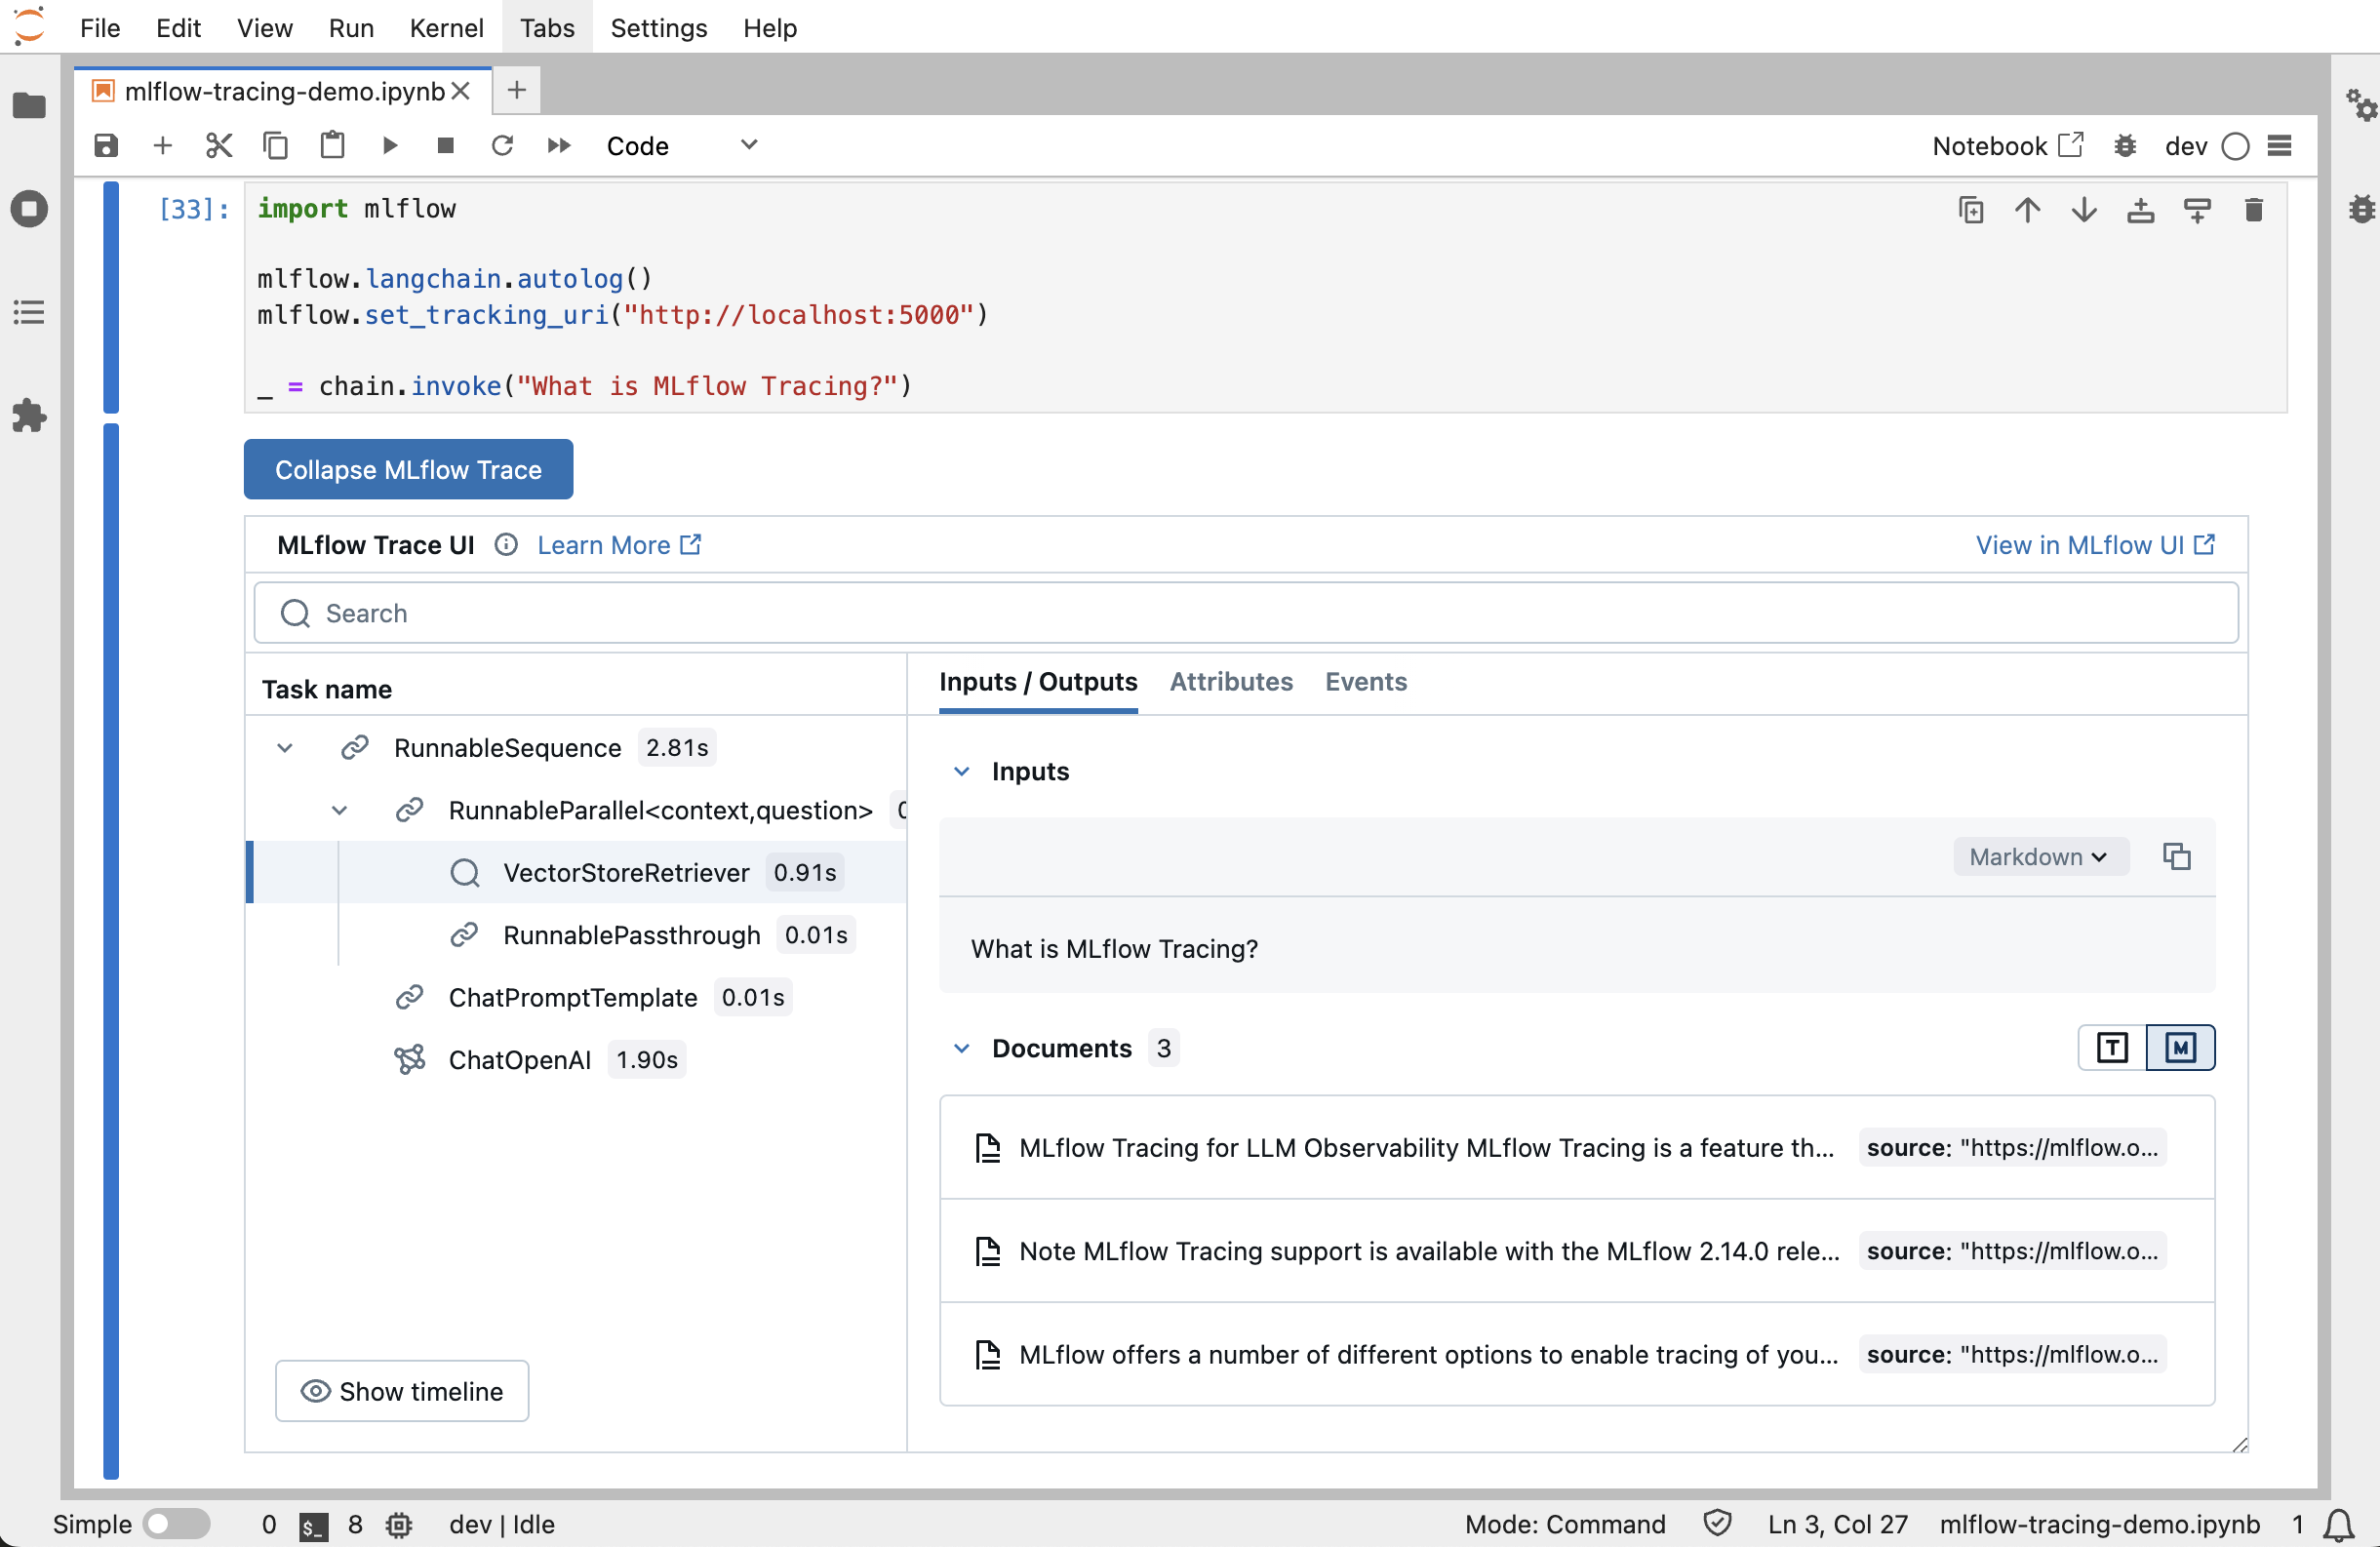
This feature requires using an MLflow Tracking Server, as
this is where the UI assets are fetched from. To get started, simply ensure that the MLflow
Tracking URI is set to your tracking server (e.g. mlflow.set_tracking_uri("http://localhost:5000")).
By default, the trace UI will automatically be displayed for the following events:
- When the cell code generates a trace (e.g. via automatic tracing, or by running a manually traced function)
- When
mlflow.search_traces()is called - When a
mlflow.entities.Trace()object is displayed (e.g. via IPython'sdisplayfunction, or when it is the last value returned in a cell)
To disable the display, simply call mlflow.tracing.disable_notebook_display(), and rerun the cell
containing the UI. To enable it again, call mlflow.tracing.enable_notebook_display().