Tracing Quickstart (Python)
The TypeScript/JavaScript quickstart is available here.
This quickstart guide will walk you through setting up a simple GenAI application with MLflow Tracing. In less than 10 minutes, you'll enable tracing, run a basic application, and explore the generated traces in the MLflow UI.
Prerequisites
Install the required packages by running the following command:
pip install --upgrade mlflow openai>=1.0.0
The code example in this guide uses the OpenAI SDK; however, the contents of this guide are applicable to any other LLM providers, such as Anthropic, Google, Bedrock, and more.
Step 1: Set up your environment
Connect to MLflow
MLflow logs Traces in a tracking server. Connect your local environment to the tracking server by one of the following methods.
- Local (pip)
- Local (docker)
- Remote MLflow Server
- Databricks
For the fastest setup, you can install the mlflow Python package and run MLflow locally:
mlflow ui --backend-store-uri sqlite:///mlflow.db --port 5000
This will start the server at port 5000 on your local machine. Connect your notebook/IDE to the server by setting the tracking URI. You can also access to the MLflow UI at http://localhost:5000.
import mlflow

mlflow.set_tracking_uri("http://localhost:5000")
You can also brows the MLflow UI at http://localhost:5000.
MLflow provides a Docker Compose file to start a local MLflow server with a postgres database and a minio server.
git clone https://github.com/mlflow/mlflow.git
cd docker-compose
cp .env.dev.example .env
docker compose up -d
This will start the server at port 5000 on your local machine. Connect your notebook/IDE to the server by setting the tracking URI. You can also access to the MLflow UI at http://localhost:5000.
import mlflow

mlflow.set_tracking_uri("http://localhost:5000")
Refer to the instruction for more details, e.g., overriding the default environment variables.
If you have a remote MLflow tracking server, configure the connection:
import os
import mlflow

# Set your MLflow tracking URI
os.environ["MLFLOW_TRACKING_URI"] = "http://your-mlflow-server:5000"
# Or directly in code
mlflow.set_tracking_uri("http://your-mlflow-server:5000")
If you have a Databricks account, configure the connection:
import mlflow

mlflow.login()
This will prompt you for your configuration details (Databricks Host url and a PAT).
If you are unsure about how to set up an MLflow tracking server, you can start with the cloud-based MLflow powered by Databricks: Sign up for free →
Create a new MLflow Experiment
import mlflow

# This will create a new experiment called "Tracing Quickstart" and set it as active
mlflow.set_experiment("Tracing Quickstart")
Configure OpenAI API Key (or other LLM providers)
import os

# Use different env variable when using a different LLM provider
os.environ["OPENAI_API_KEY"] = "your-api-key-here"  # Replace with your actual API key
Step 2: Trace a single LLM call
Let's start with a simple example of tracing a single LLM call. We first enable automatic tracing for OpenAI API calls by calling mlflow.openai.autolog(). After that, every call to OpenAI API will generate a trace span, capturing the input, output, latency, token counts, and other metadata.
import mlflow
from openai import OpenAI

# Enable automatic tracing for all OpenAI API calls
mlflow.openai.autolog()

# Instantiate the OpenAI client
client = OpenAI()

# Invoke chat completion API
response = client.chat.completions.create(
    model="o4-mini",
    messages=[
        {"role": "system", "content": "You are a helpful weather assistant."},
        {"role": "user", "content": "What's the weather like in Seattle?"},
    ],
)
After running the code above, go to the MLflow UI and select the "Traces" tab. It should show the newly created trace.
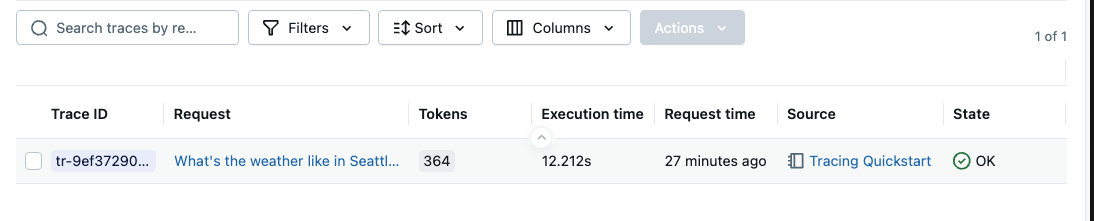
The table view shows the primary metadata of the trace, such as the trace ID, execution duration, token count, source system and status. You can add or remove displayed columns by selecting the columns in the drop down. By clicking on the request row (the linked request text), you can view the detailed spans in the trace.
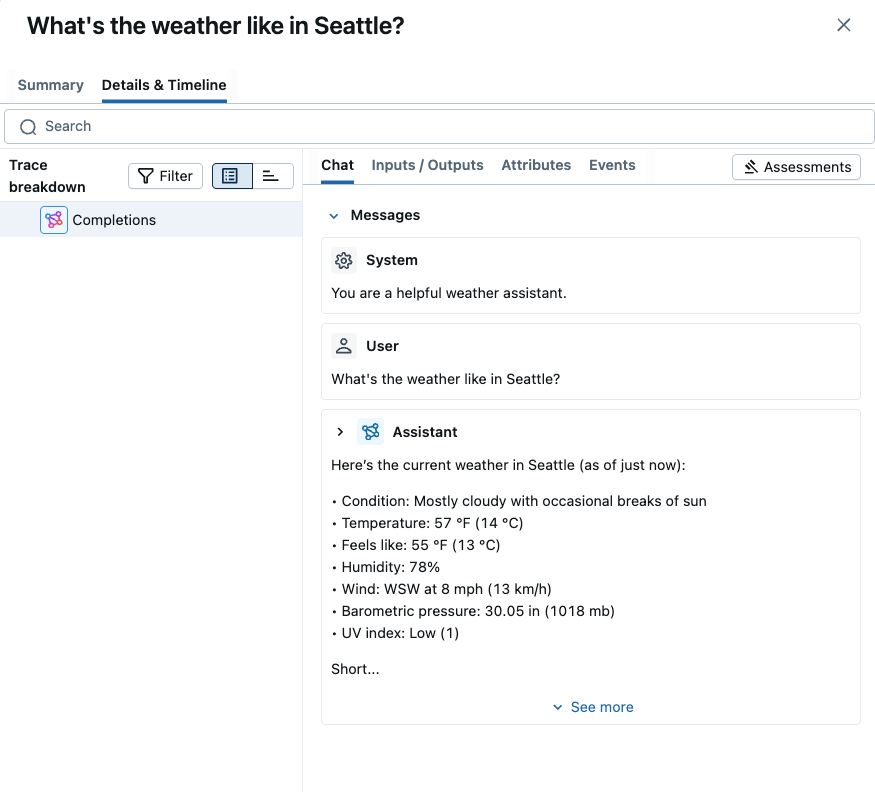
The "Chat" view in the above screenshot shows the full chat messages exchanged between the user and the model. By clicking other tables such as "Inputs / Outputs" or "Attributes", you can see different aspects of the trace, including the raw input payload, token usage breakdown, and more.
Step 3: Trace a tool calling agent
Next, let's add a bit more complexity to the application. To get the real-time weather information, we will use an external weather API as a tool. The application will include a tool calling flow, not only a simple LLM call. To instrument that custom Python flow, we will use the @mlflow.trace decorator. Use of this simple decorator generates a span for the function call and automatically captures the function inputs, outputs, latency, and exceptions.
Let's define a Python function that fetches the weather information from a weather API.
import requests
from mlflow.entities import SpanType
# Decorated with @mlflow.trace to trace the function call.
@mlflow.trace(span_type=SpanType.TOOL)
def get_weather(latitude, longitude):
response = requests.get(
f"https://api.open-meteo.com/v1/forecast?latitude={latitude}&longitude={longitude}¤t=temperature_2m,wind_speed_10m&hourly=temperature_2m,relative_humidity_2m,wind_speed_10m"
)
data = response.json()
return data["current"]["temperature_2m"]
To pass the function as a tool to the LLM, we need to define the JSON schema for the function.
tools = [
    {
        "type": "function",
        "function": {
            "name": "get_weather",
            "description": "Get current temperature for provided coordinates in celsius.",
            "parameters": {
                "type": "object",
                "properties": {
                    "latitude": {"type": "number"},
                    "longitude": {"type": "number"},
                },
                "required": ["latitude", "longitude"],
                "additionalProperties": False,
            },
            "strict": True,
        },
    }
]
Lastly, define a simple flow that first asks the LLM to get instructions for calling the tool, then invokes the tool function, and lastly returns the result to the LLM.
import json
from mlflow.entities import SpanType


# Define a simple tool calling agent
@mlflow.trace(span_type=SpanType.AGENT)
def run_tool_agent(question: str):
    messages = [{"role": "user", "content": question}]

    # Invoke the model with the given question and available tools
    response = client.chat.completions.create(
        model="o4-mini",
        messages=messages,
        tools=tools,
    )
    ai_msg = response.choices[0].message
    messages.append(ai_msg)

    # If the model requests tool call(s), invoke the function with the specified arguments
    if tool_calls := ai_msg.tool_calls:
        for tool_call in tool_calls:
            function_name = tool_call.function.name
            if function_name == "get_weather":
                # Invoke the tool function with the provided arguments
                args = json.loads(tool_call.function.arguments)
                tool_result = get_weather(**args)
            else:
                raise RuntimeError("An invalid tool is returned from the assistant!")

            messages.append(
                {
                    "role": "tool",
                    "tool_call_id": tool_call.id,
                    "content": str(tool_result),
                }
            )

        # Sent the tool results to the model and get a new response
        response = client.chat.completions.create(model="o4-mini", messages=messages)

    return response.choices[0].message.content
Now we can run the application.
# Run the tool calling agent
question = "What's the weather like in Seattle?"
answer = run_tool_agent(question)
Step 4: Explore Traces in the UI
After running the application, you can explore the traces in the MLflow UI.
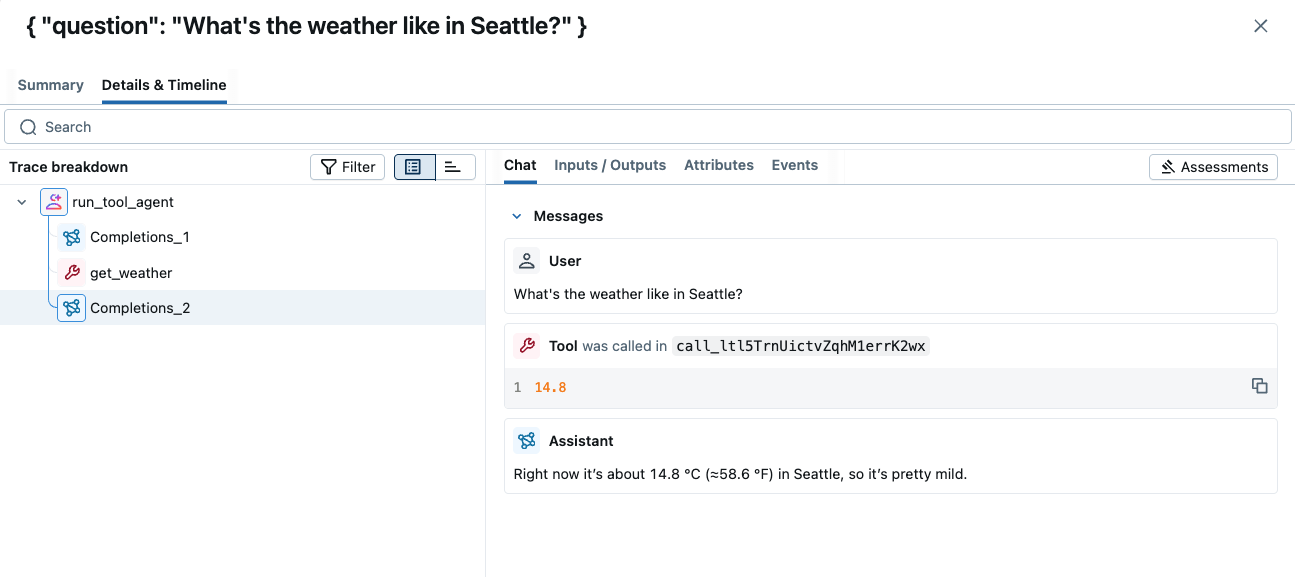
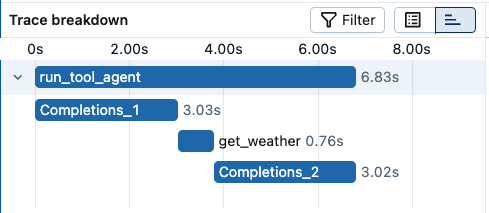
The trace shows all LLM invocations and tool calls, organized in a tree structure. You can also inspect the timeline breakdown by clicking the timeline icon next to the tree view. This helps you understand where the time is spent in the application.
Step 5: Attach Feedbacks on Traces
As a last step of this quickstart, let's attach feedback on the generated traces. In real world development, human feedback is critical to improve the quality of any LLM-powered application.
To add a feedback to a trace, you can open the trace detail page and click the "Add new Assessment" button on the top right. It will open an input form where you can provide various feedback values and metadata. For example, we can add feedback called "Quality" with an integer value (1~5), indicating how good the answer is. We can also put the detailed rationale behind the score for future reference.
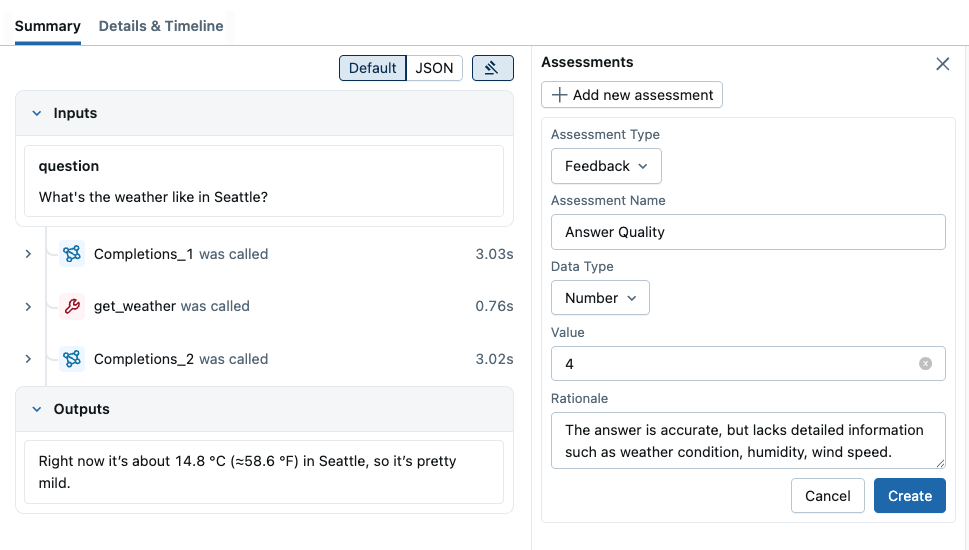
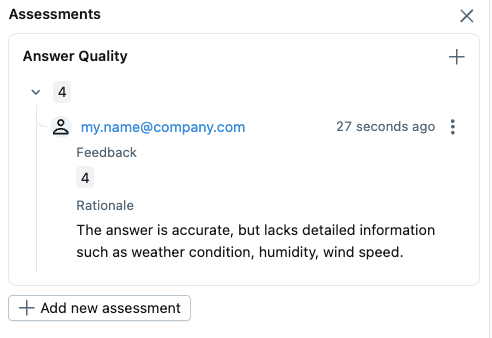
When you submit the form with "Create" button, the feedback will be attached to the trace.
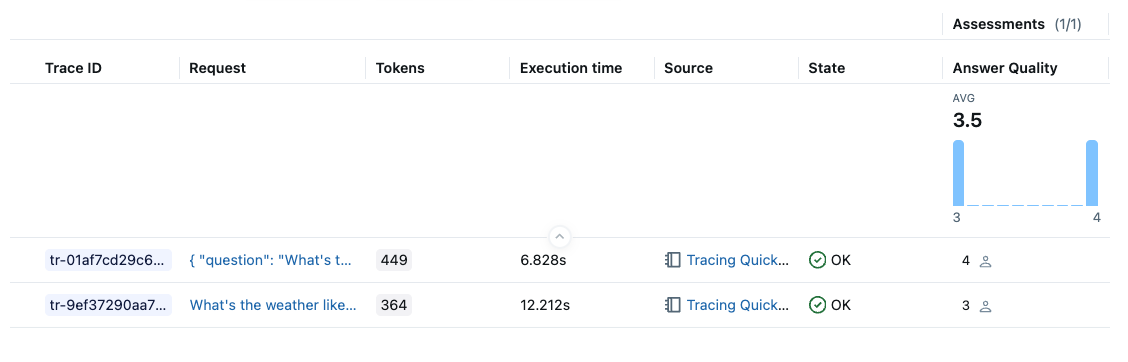
The aggregated score in the experiment can be seen in the Trace list. You can do slice-and-dice by various criteria, such as timestamp, source, tags, and it will update the aggregated score in real-time.
Summary
Congratulations! You've successfully:
- ✅ Set up MLflow Tracing for a GenAI application
- ✅ Enabled automatic tracing for OpenAI API calls
- ✅ Generated and explored traces in the MLflow UI
- ✅ Learned how to add custom tracing using decorators
- ✅ Learned how to attach feedback on traces
MLflow Tracing provides powerful observability for your GenAI applications, helping you monitor performance, debug issues, and understand user interactions. Continue exploring the advanced features to get the most out of your tracing setup!
Next Steps
Now that you have basic tracing working, explore these advanced features:
- Integration with Other Libraries: Use MLflow Tracing with other LLM providers and frameworks, such as LangGraph, Pydantic AI.
- Automatic Evaluation: Learn how to set up automatic evaluation for traces using MLflow's GenAI evaluation feature.
- Production Monitoring: Learn how to use MLflow Tracing in production set up with the optimized SDK.