Search Traces
This guide will walk you through how to search for traces in MLflow using both the MLflow UI and Python API. This resource will be valuable if you're interested in querying specific traces based on their metadata, tags, execution time, status, or other trace attributes.
MLflow's trace search functionality allows you to leverage SQL-like syntax to filter your traces based on a variety of conditions. While the OR keyword is not supported, the search functionality is powerful enough to handle complex queries for trace discovery and analysis.
Local File Store offers only limited search capabilities and can become slow as data volume grows. As of MLflow 3.6.0, the FileStore is deprecated. We recommend migrating to a SQL-backed store or Databricks for improved performance and more robust search functionality.
Search Traces Overview
When working with MLflow tracing in production environments, you'll often have thousands of traces across different experiments representing various model inferences, LLM calls, or ML pipeline executions. The search_traces API helps you find specific traces based on their execution characteristics, metadata, tags, and other attributes - making trace analysis and debugging much more efficient.
Filtering Traces in the UI
The UI search supports all the same filter syntax as the API, allowing you to search by:
- Trace inputs
- Trace attributes: trace name, status, end time, execution time, run_id
- Trace tags and metadata
- Trace assessments: feedback or expectations
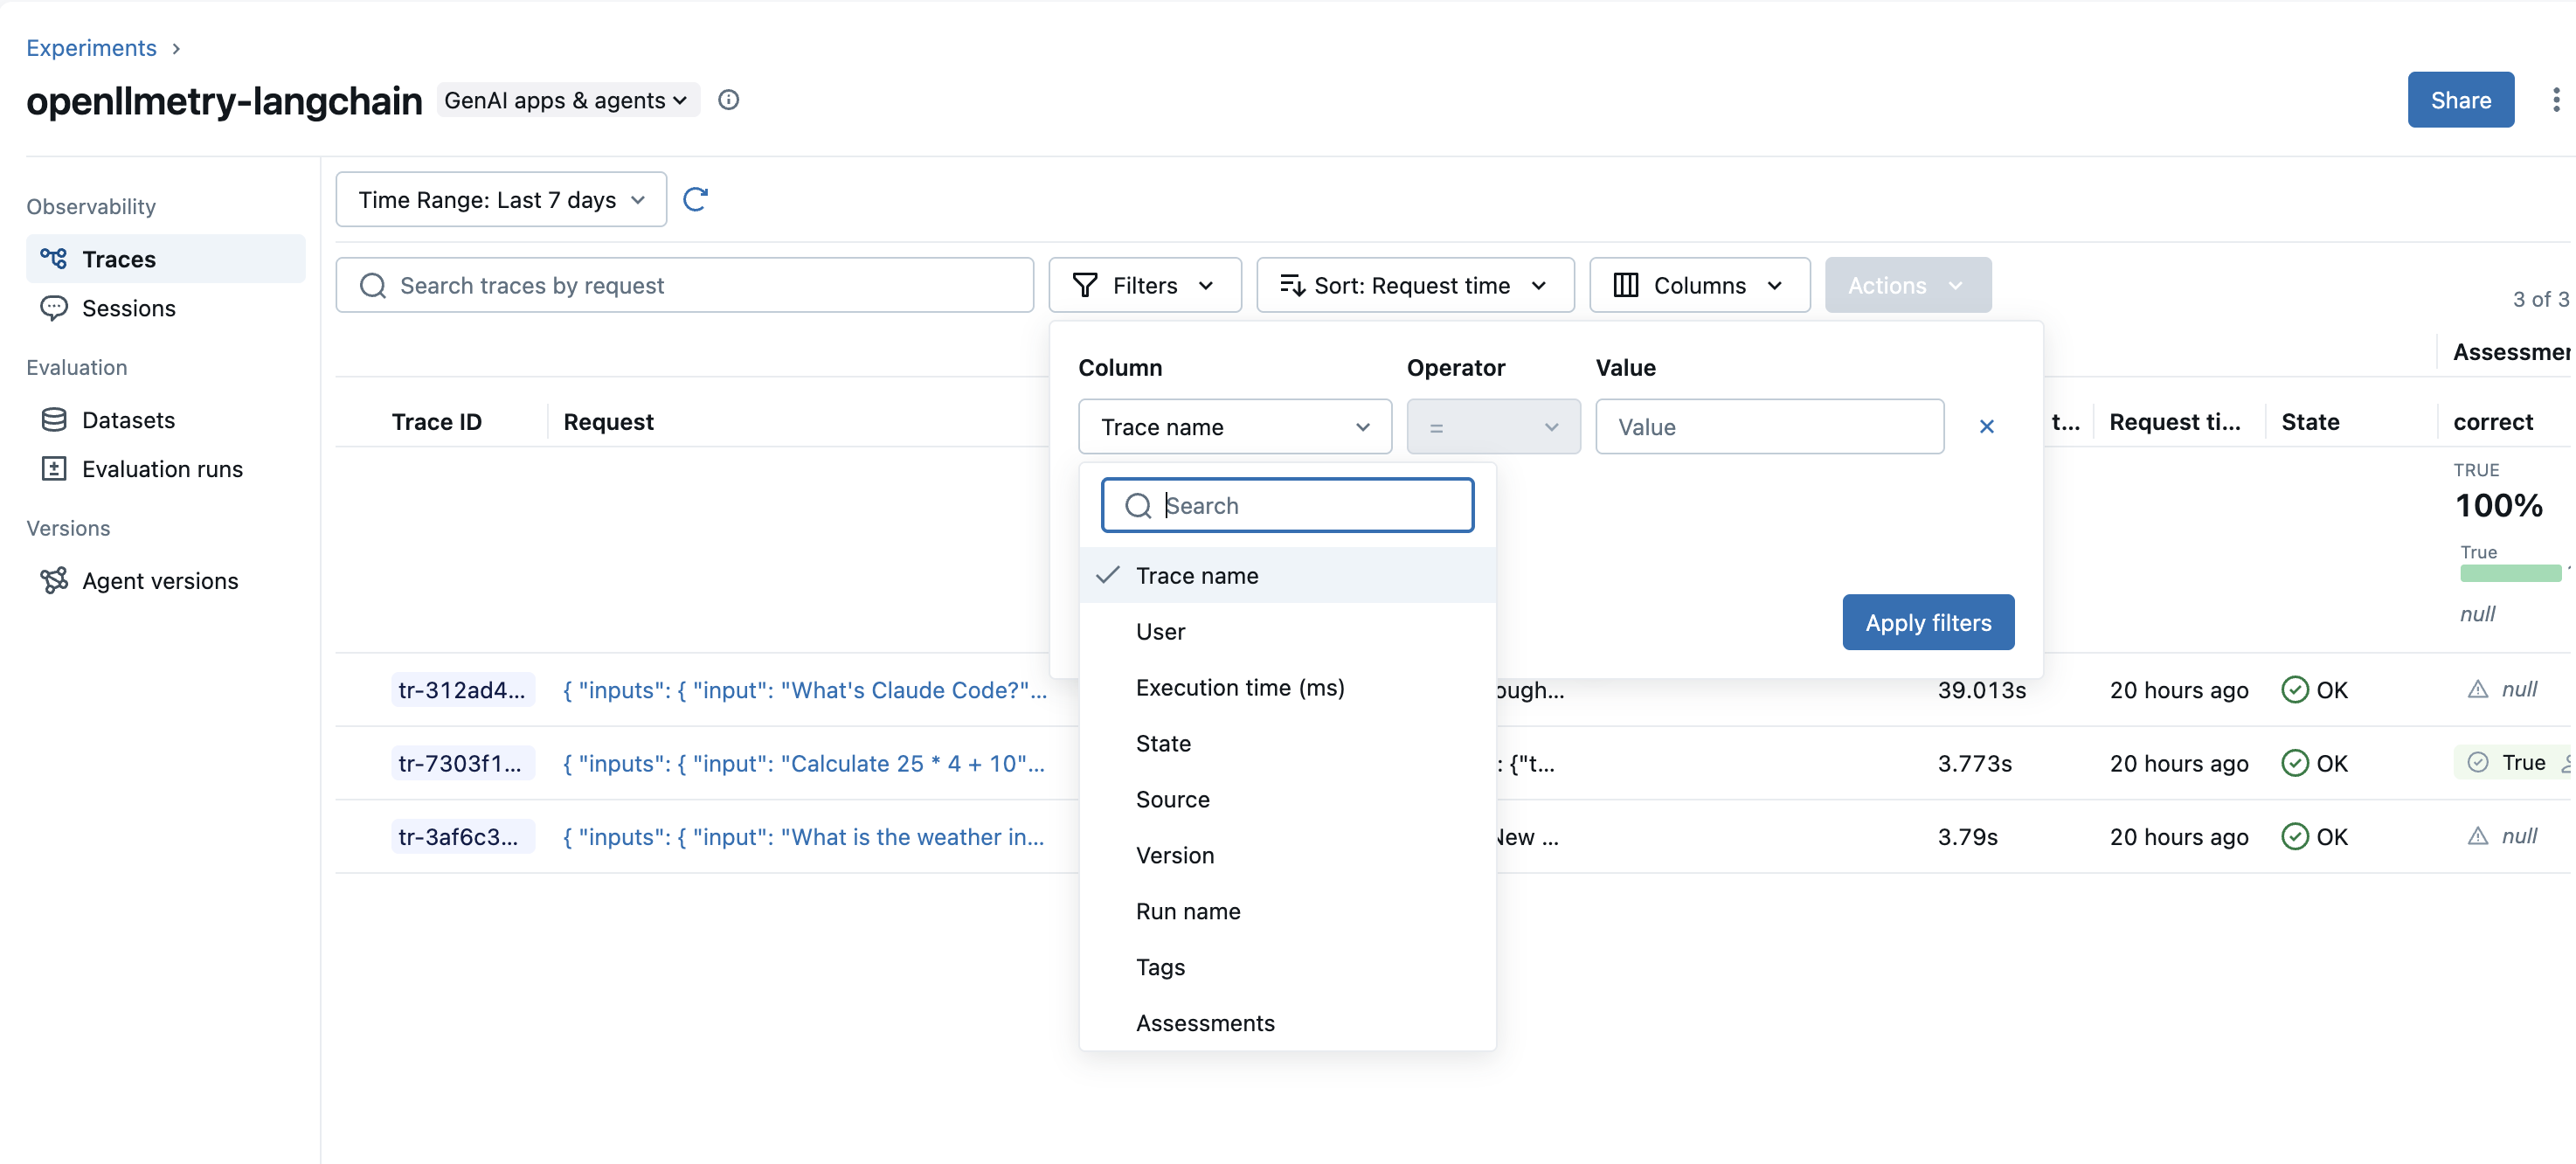
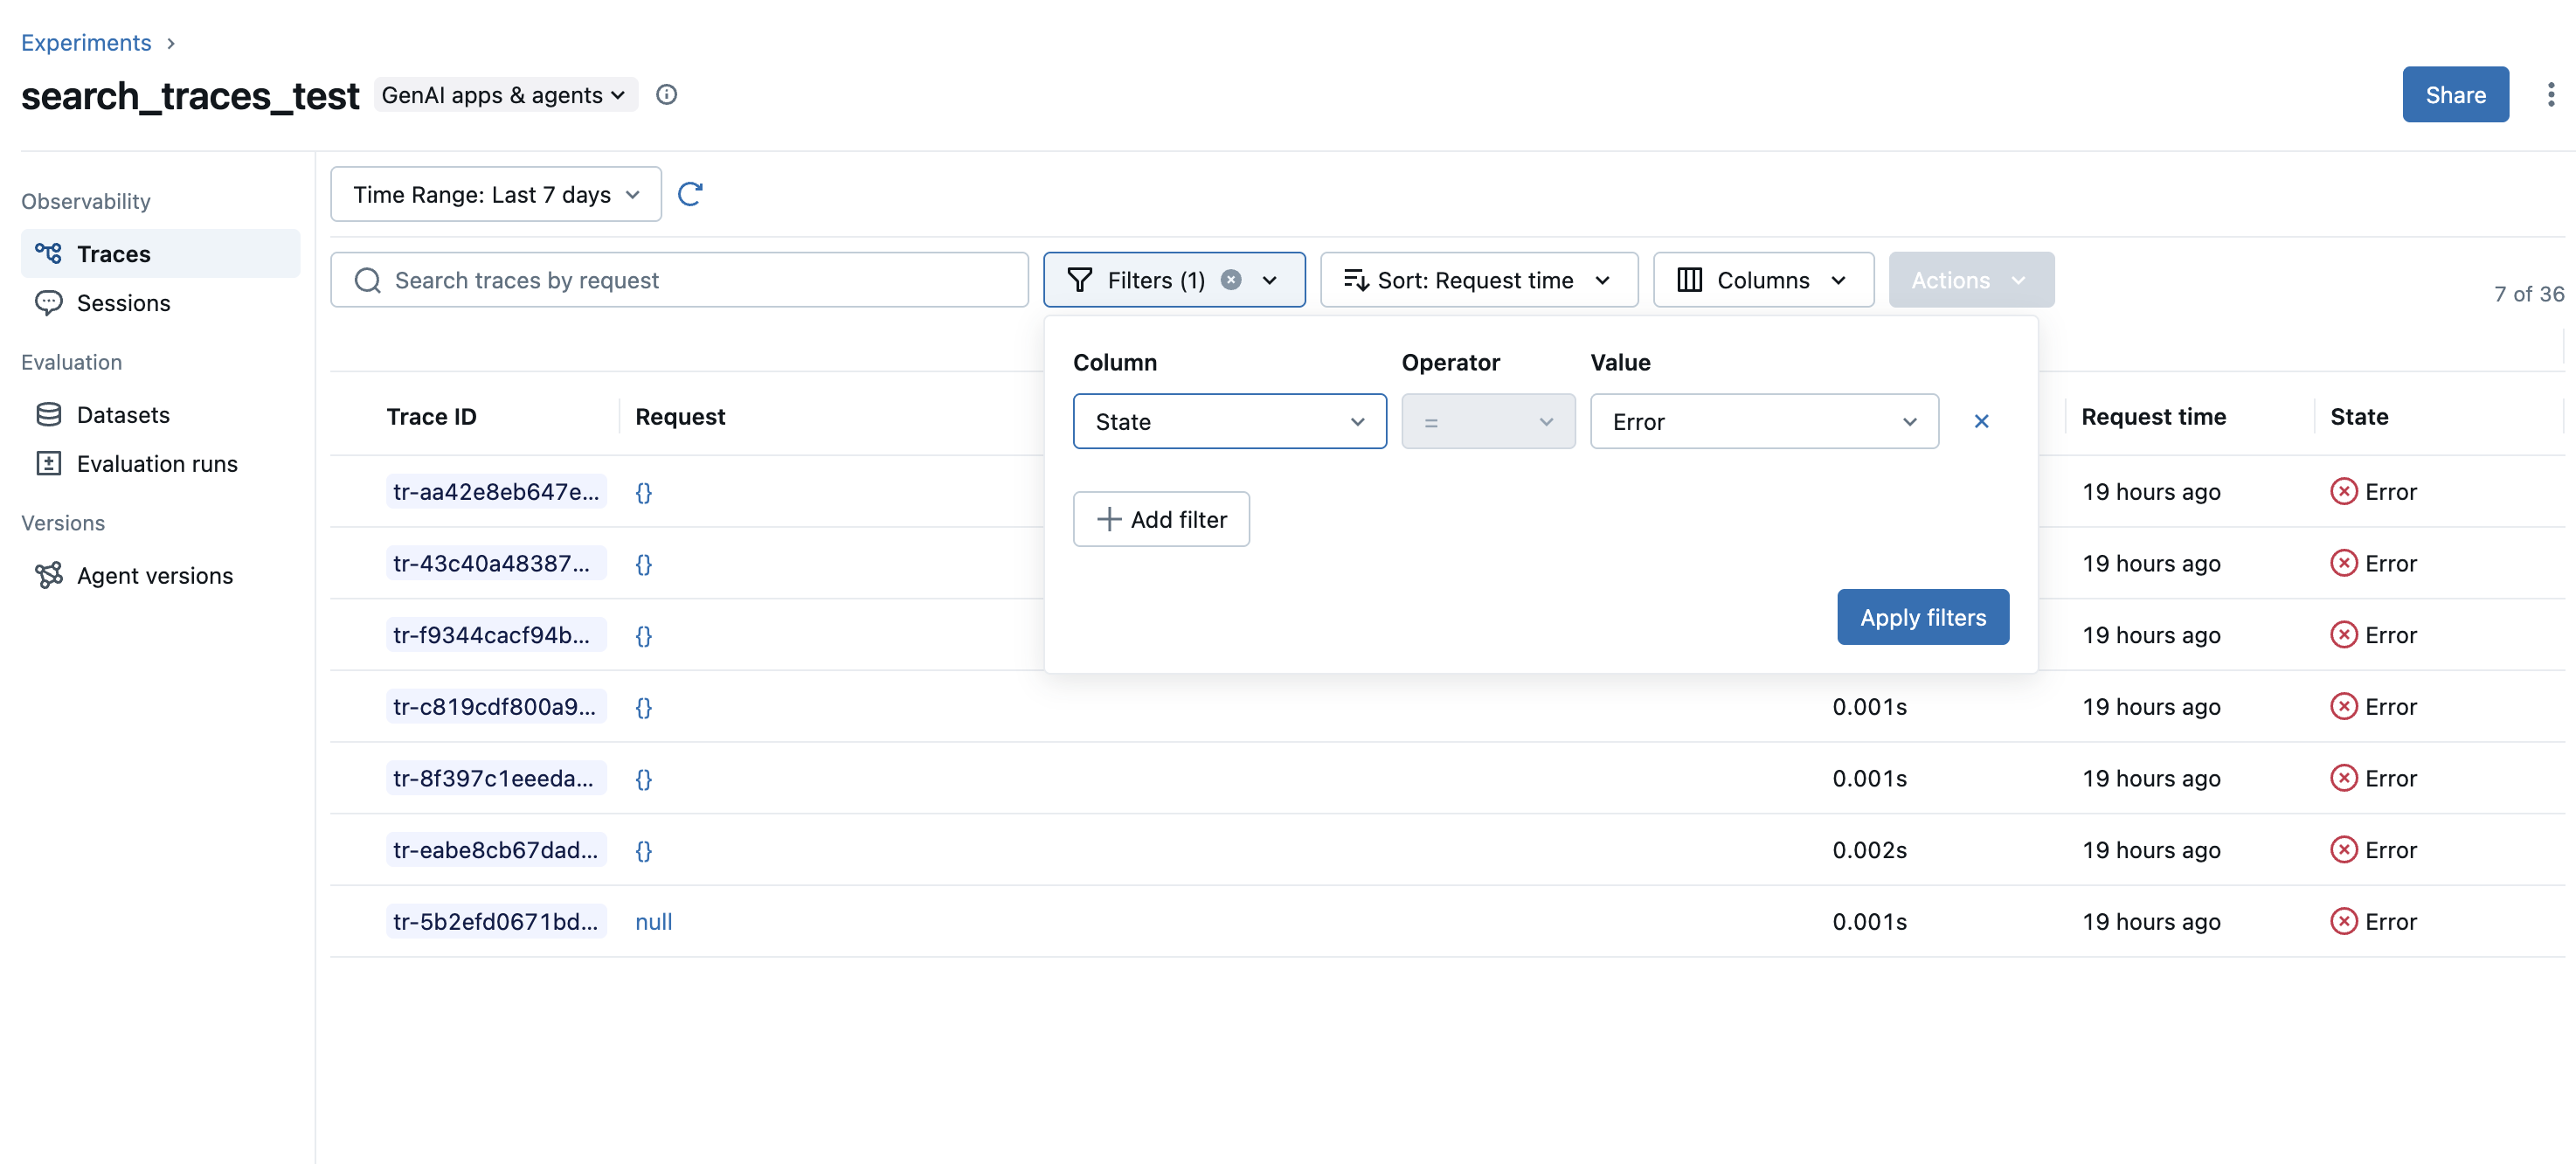
Use the filters dropdown in the MLflow Trace UI to filter traces by various criteria:
For example, searching for traces that with ERROR state:
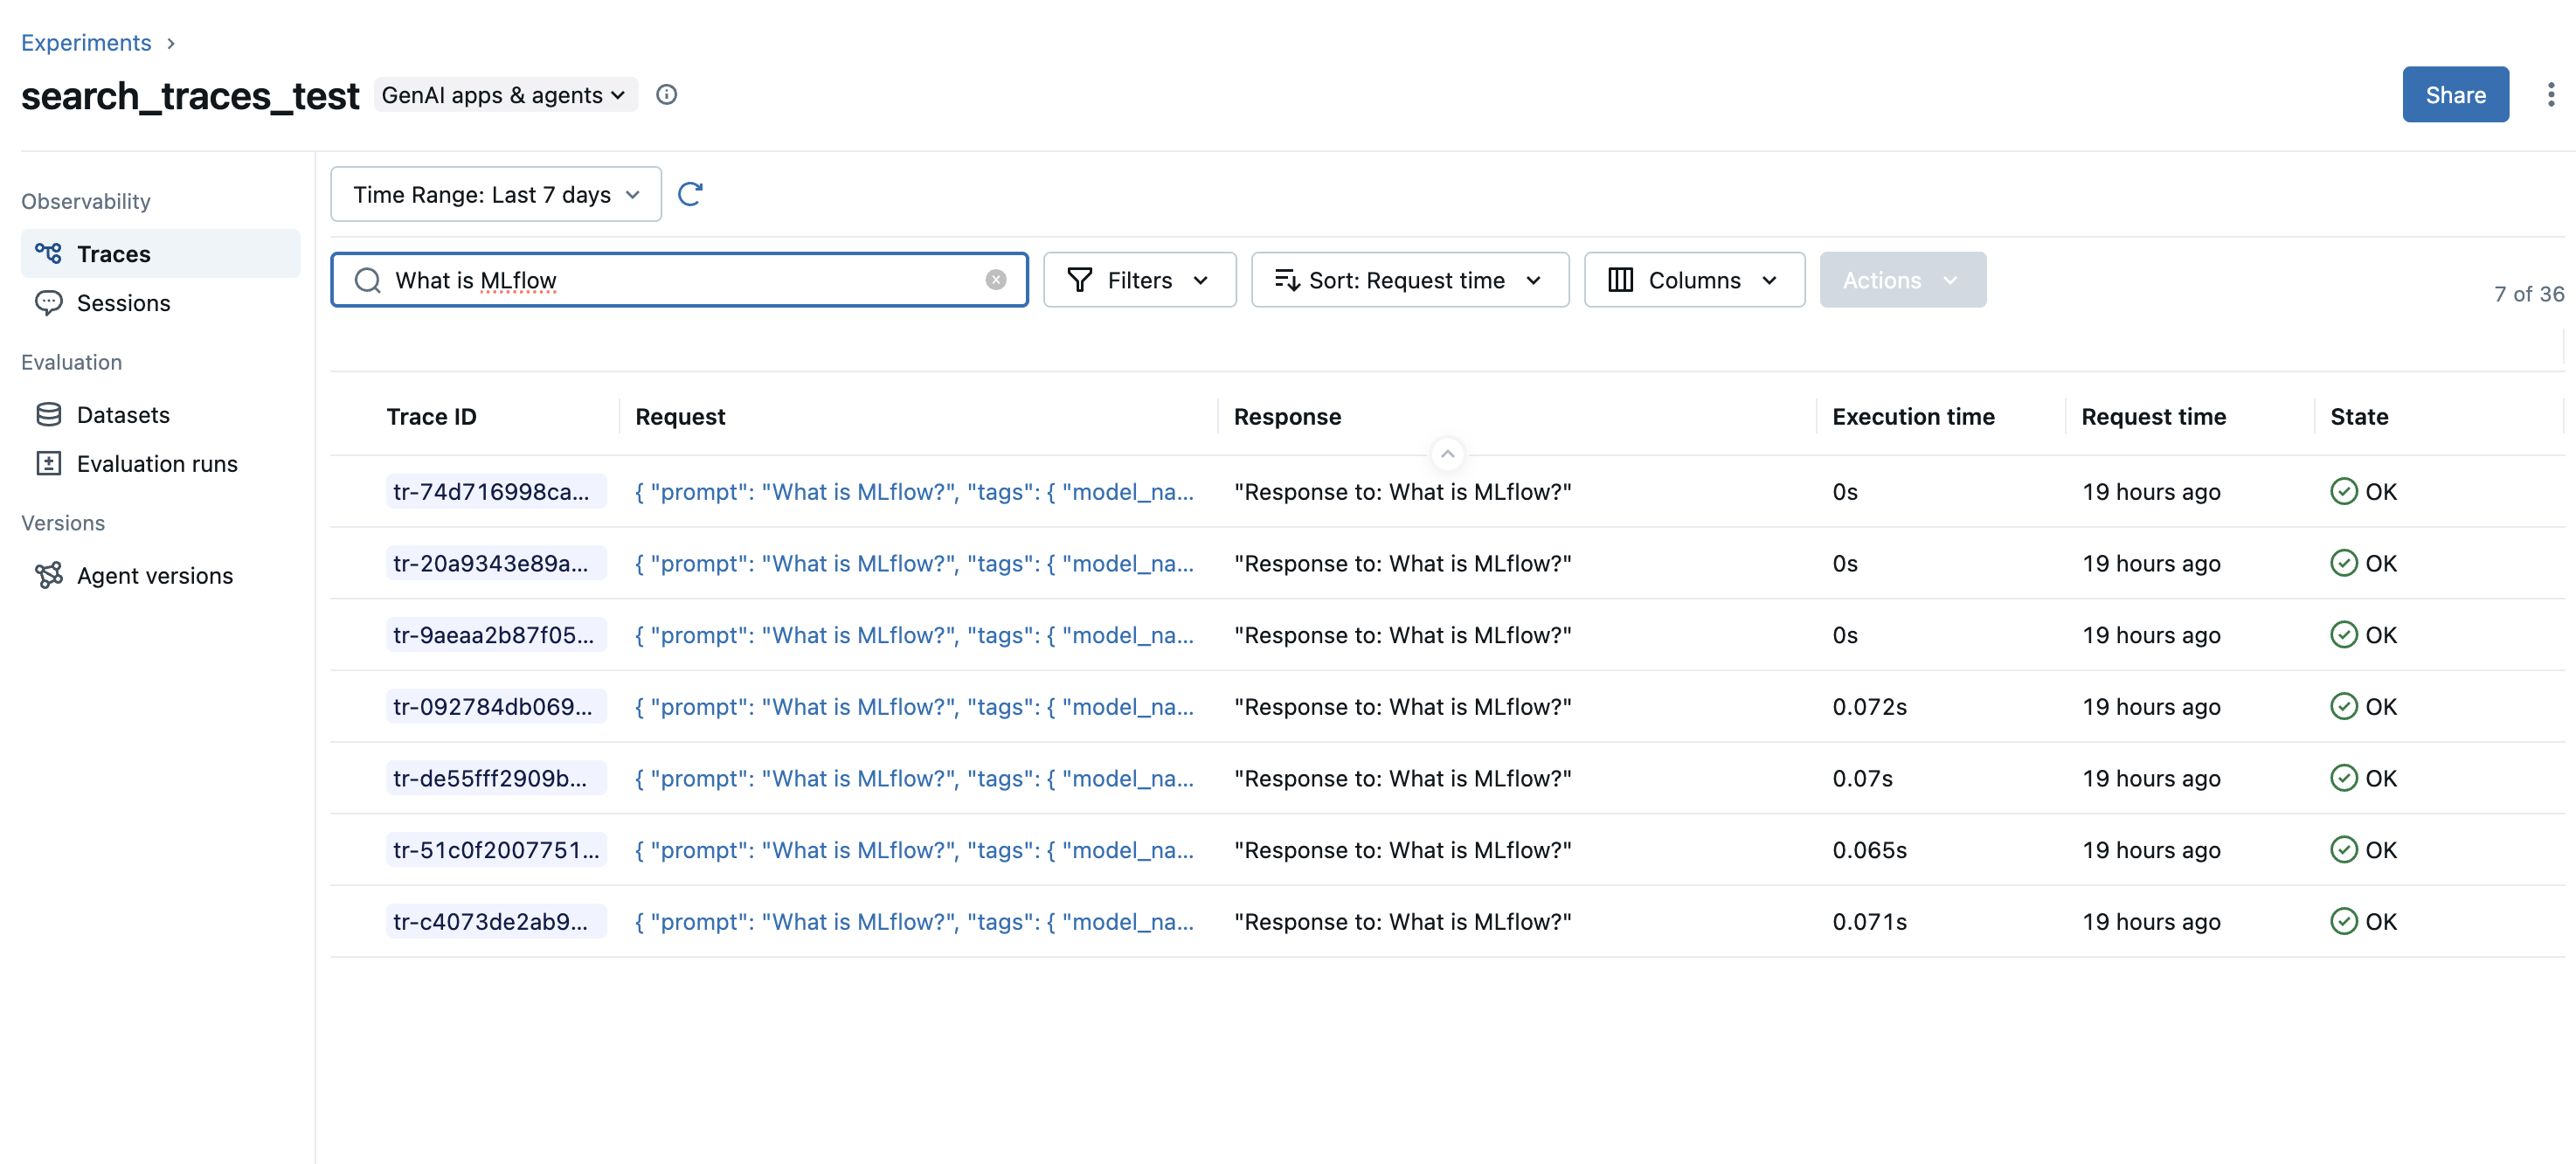
Search for trace inputs:
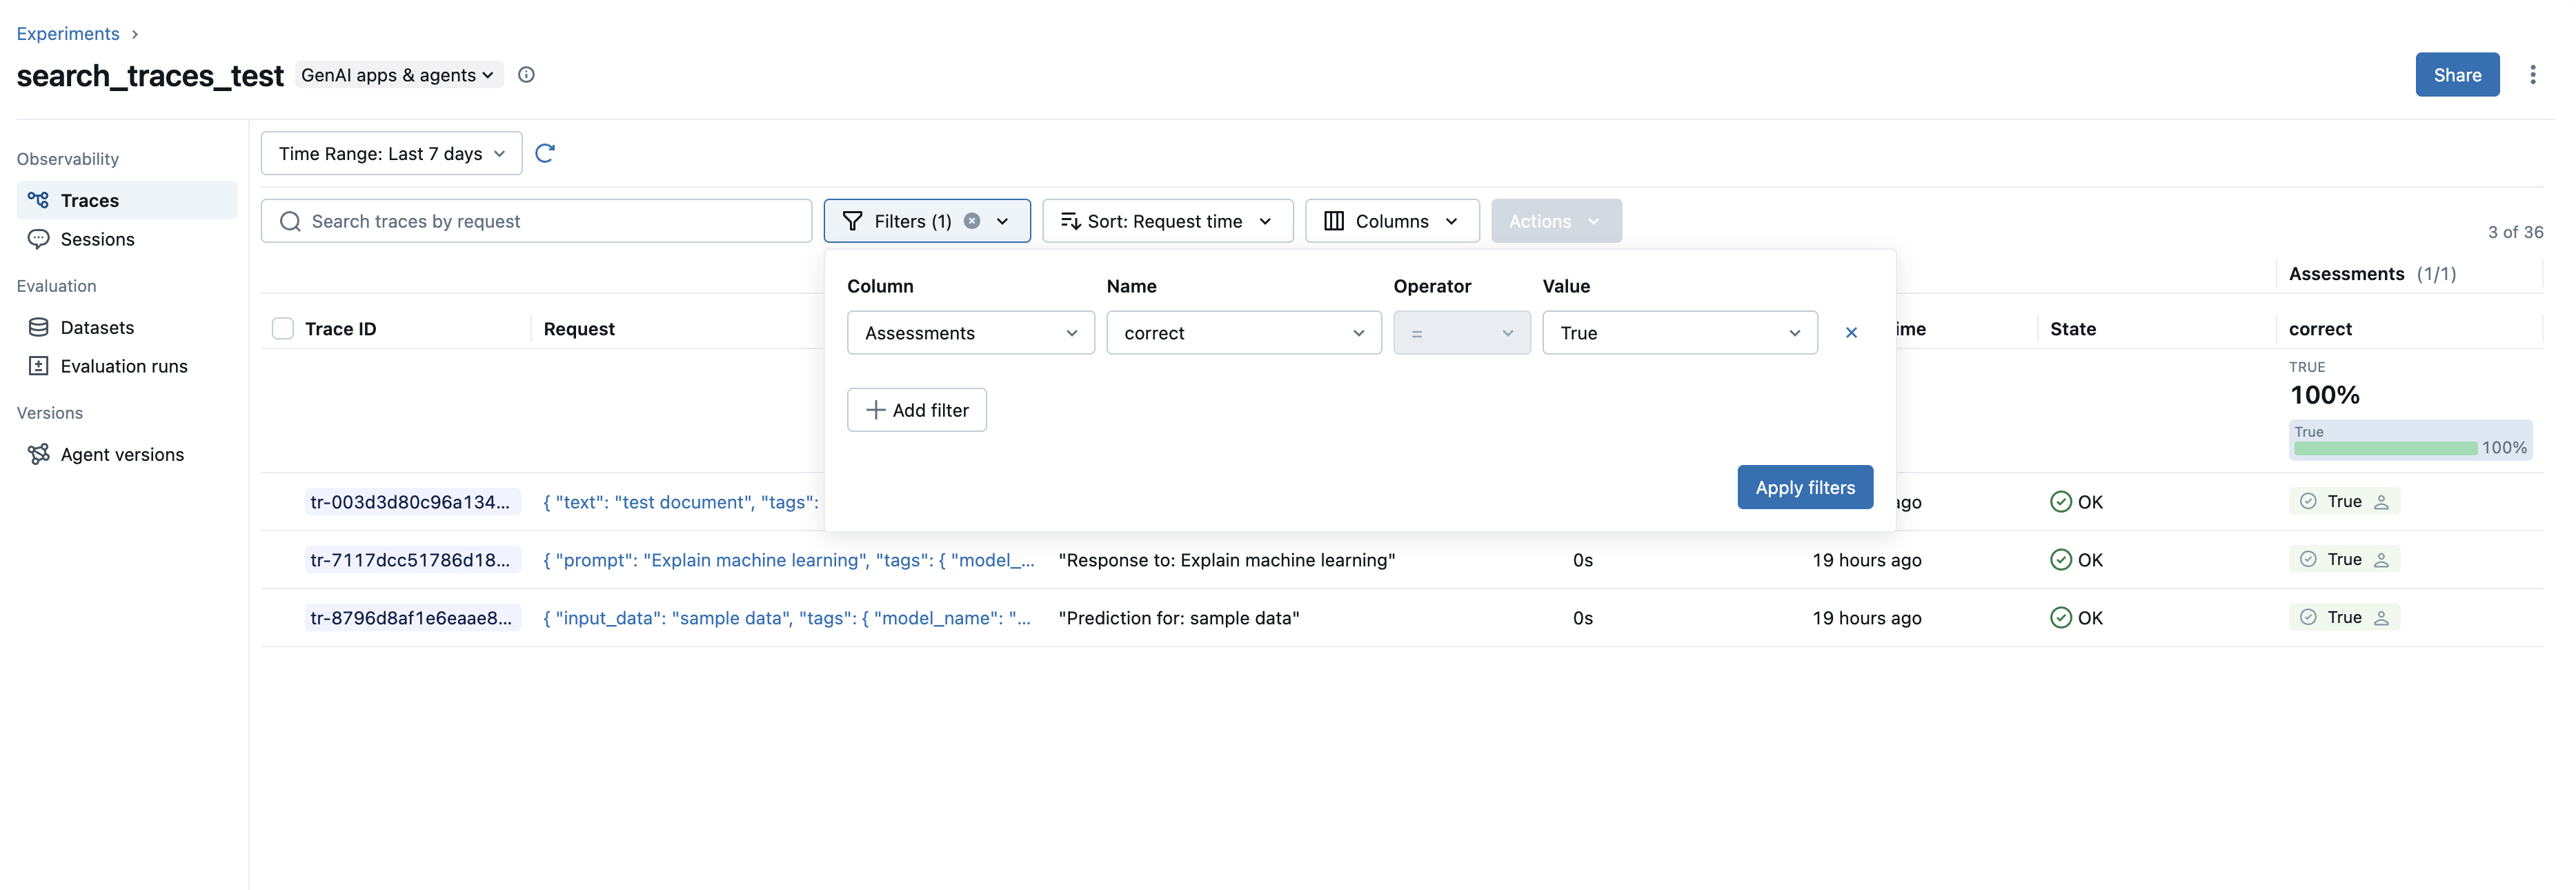
Search for trace assessments by key and value:
Search Query Syntax
The search_traces API uses a SQL-like Domain Specific Language (DSL) for querying traces.
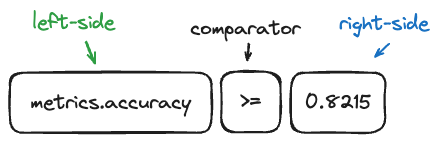
Visual Representation of Search Components:
Supported Filters and Comparators
| Field Type | Fields | Operators | Examples |
|---|---|---|---|
| Trace Status | trace.status | =, != | trace.status = "OK" |
| Trace Timestamps | trace.timestamp_ms, trace.execution_time_ms, trace.end_time_ms | =, !=, >, <, >=, <= | trace.end_time_ms > 1762408895531 |
| Trace IDs | trace.run_id | = | trace.run_id = "run_id" |
| String Fields | trace.client_request_id, trace.name | =, !=, LIKE, ILIKE, RLIKE | trace.name LIKE "%Generate%" |
| Linked Prompts | prompt | = (format: "name/version") | prompt = "qa-system-prompt/4" |
| Span Name/Type | span.name, span.type | =, !=, LIKE, ILIKE, RLIKE | span.type RLIKE "^LLM" |
| Span Attributes | span.attributes.<key> | LIKE, ILIKE | span.attributes.model RLIKE "^gpt" |
| Tags | tag.<key> | =, !=, LIKE, ILIKE, RLIKE | tag.key = "value" |
| Metadata | metadata.<key> | =, !=, LIKE, ILIKE, RLIKE, IS NULL, IS NOT NULL | metadata.user_id LIKE "user%" |
| Feedback | feedback.<name> | =, !=, LIKE, ILIKE, RLIKE | feedback.rating = "excellent" |
| Expectations | expectation.<name> | =, !=, LIKE, ILIKE, RLIKE | expectation.result = "pass" |
| Full Text | trace.text | LIKE (with % wildcards) | trace.text LIKE "%tell me a story" |
Value Syntax:
- String values must be quoted:
status = 'OK' - Numeric values don't need quotes:
execution_time_ms > 1000 - Tag and metadata values must be quoted as strings
- Full text search must use
LIKEwith%wildcards
Pattern Matching Operators:
LIKE: Case-sensitive pattern matching (use%for wildcards)ILIKE: Case-insensitive pattern matching (use%for wildcards)RLIKE: Regular expression matching
Example Queries
Full Text Search
Search for any contents existing in your trace.
# Search for traces containing specific text
mlflow.search_traces(filter_string="trace.text LIKE '%authentication error%'")

# Search for multiple terms
mlflow.search_traces(filter_string="trace.text LIKE '%timeout%'")
Filter by Name
# Exact match
mlflow.search_traces(filter_string="trace.name = 'predict'")

# Pattern matching with LIKE
mlflow.search_traces(filter_string="trace.name LIKE '%inference%'")

# Case-insensitive pattern matching with ILIKE
mlflow.search_traces(filter_string="trace.name ILIKE '%PREDICT%'")

# Regular expression matching with RLIKE
mlflow.search_traces(filter_string="trace.name RLIKE '^(predict|inference)_[0-9]+'")
Filter by Status
# Get successful traces
mlflow.search_traces(filter_string="trace.status = 'OK'")

# Get failed traces
mlflow.search_traces(filter_string="trace.status = 'ERROR'")

# Get in-progress traces
mlflow.search_traces(filter_string="trace.status != 'OK'")
Filter by Execution Time
# Find slow traces (> 1 second)
mlflow.search_traces(filter_string="trace.execution_time_ms > 1000")

# Performance range
mlflow.search_traces(
    filter_string="trace.execution_time_ms >= 200 AND trace.execution_time_ms <= 800"
)

# Equal to specific duration
mlflow.search_traces(filter_string="trace.execution_time_ms = 500")
Filter by Timestamp
import time

# Get traces from last hour
timestamp = int(time.time() * 1000)
mlflow.search_traces(filter_string=f"trace.timestamp_ms > {timestamp - 3600000}")

# Exact timestamp match
mlflow.search_traces(filter_string=f"trace.timestamp_ms = {timestamp}")

# Timestamp range
mlflow.search_traces(
    filter_string=f"trace.timestamp_ms >= {timestamp - 7200000} AND trace.timestamp_ms <= {timestamp - 3600000}"
)
Filter by Tags
# Exact match
mlflow.search_traces(filter_string="tag.model_name = 'gpt-4'")

# Pattern matching with LIKE (case-sensitive)
mlflow.search_traces(filter_string="tag.model_name LIKE 'gpt-%'")

# Case-insensitive pattern matching with ILIKE
mlflow.search_traces(filter_string="tag.environment ILIKE '%prod%'")

# Regular expression matching with RLIKE
mlflow.search_traces(filter_string="tag.version RLIKE '^v[0-9]+\\.[0-9]+'")
Filter by Metadata
# Exact match
mlflow.search_traces(filter_string="metadata.user_id = 'user_123'")

# Find traces where metadata key exists
mlflow.search_traces(filter_string="metadata.session_id IS NOT NULL")

# Find traces where metadata key is missing
mlflow.search_traces(filter_string="metadata.region IS NULL")

# Combine null checks with other filters
mlflow.search_traces(
    filter_string="metadata.region IS NOT NULL AND metadata.env = 'production'"
)
Filter by Run Association
# Find traces associated with a specific run
mlflow.search_traces(filter_string="trace.run_id = 'run_id_123456'")
Filter by Linked Prompts
# Find traces using a specific prompt version
mlflow.search_traces(filter_string='prompt = "qa-agent-system-prompt/4"')
The prompt filter only supports exact match (=) operator with the format "name/version".
Filter by Span Attributes
# Filter by span name
mlflow.search_traces(filter_string="span.name = 'llm_call'")

# Pattern matching on span name
mlflow.search_traces(filter_string="span.name LIKE '%embedding%'")

# Filter by span type
mlflow.search_traces(filter_string="span.type = 'LLM'")

# Filter by custom span attributes (requires wildcards with LIKE/ILIKE)
mlflow.search_traces(filter_string="span.attributes.model_version LIKE '%v2%'")
mlflow.search_traces(filter_string="span.attributes.temperature LIKE '%0.7%'")
mlflow.search_traces(filter_string="span.attributes.model_version ILIKE '%V2%'")
Filter by Feedback
# Filter by feedback ratings
mlflow.search_traces(filter_string="feedback.rating = 'positive'")

# Pattern matching on feedback
mlflow.search_traces(filter_string="feedback.user_comment LIKE '%helpful%'")
Filter by Expectations
# Filter by expectation values
mlflow.search_traces(filter_string="expectation.accuracy = 'high'")

# Pattern matching on expectations
mlflow.search_traces(filter_string="expectation.label ILIKE '%success%'")
Filter by End Time
import time

# Get traces that completed in the last hour
end_time = int(time.time() * 1000)
mlflow.search_traces(filter_string=f"trace.end_time_ms > {end_time - 3600000}")

# Find traces that ended within a specific time range
mlflow.search_traces(
    filter_string=f"trace.end_time_ms >= {end_time - 7200000} AND trace.end_time_ms <= {end_time - 3600000}"
)
Combine Multiple Conditions
# Complex query with tags and status
mlflow.search_traces(filter_string="trace.status = 'OK' AND tag.importance = 'high'")

# Production error analysis with execution time
mlflow.search_traces(
    filter_string="""
        tag.environment = 'production'
        AND trace.status = 'ERROR'
        AND trace.execution_time_ms > 500
    """
)

# Advanced query with span attributes and feedback
mlflow.search_traces(
    filter_string="""
        span.name LIKE '%llm%'
        AND feedback.rating = 'positive'
        AND trace.execution_time_ms < 1000
    """
)

# Search with pattern matching and time range
mlflow.search_traces(
    filter_string="""
        trace.name ILIKE '%inference%'
        AND trace.timestamp_ms > 1700000000000
        AND span.attributes.model_version LIKE '%v2%'
    """
)
Programmatic Search with Python
mlflow.search_traces() provides convenient trace search functionality:
import mlflow

# Basic search with default DataFrame output
traces_df = mlflow.search_traces(filter_string="trace.status = 'OK'")

# Return as list of Trace objects
traces_list = mlflow.search_traces(
    filter_string="trace.status = 'OK'", return_type="list"
)
The return_type parameter is available in MLflow 2.21.1+. For older versions, use mlflow.client.MlflowClient.search_traces() for list output.
Return Format
1. DataFrame
The search_traces API returns a pandas DataFrame by default with the following columns:
- MLflow 3.x
- MLflow 2.x
trace_id- Primary identifiertrace- Trace objectclient_request_id- Client request IDstate- Trace state (OK, ERROR, IN_PROGRESS, STATE_UNSPECIFIED)request_time- Start time in millisecondsexecution_duration- Duration in millisecondsinputs- Input to traced logicoutputs- Output of traced logicexpectations- A dictionary of ground truth labels annotated on the tracetrace_metadata- Key-value metadatatags- Associated tagsassessments- List of assessment objects attached on the trace
request_id- Primary identifiertrace- Trace objecttimestamp_ms- Start time in millisecondsstatus- Trace statusexecution_time_ms- Duration in millisecondsrequest- Input to traced logicresponse- Output of traced logicrequest_metadata- Key-value metadataspans- Spans in tracetags- Associated tags
2. List of Trace Objects
Alternatively, you can specify return_type="list" to get a list of mlflow.entities.Trace() objects instead of a DataFrame.
traces = mlflow.search_traces(filter_string="trace.status = 'OK'", return_type="list")
# list[mlflow.entities.Trace]
Ordering Results
MLflow supports ordering results by the following keys:
timestamp_ms(default: DESC) - Trace start timeexecution_time_ms- Trace durationstatus- Trace execution statusrequest_id- Trace identifier
# Order by timestamp (most recent first)
traces = mlflow.search_traces(order_by=["timestamp_ms DESC"])

# Multiple ordering criteria
traces = mlflow.search_traces(order_by=["timestamp_ms DESC", "status ASC"])
Pagination
mlflow.client.MlflowClient.search_traces() supports pagination:
from mlflow import MlflowClient

client = MlflowClient()
page_token = None
all_traces = []

while True:
    results = client.search_traces(
        experiment_ids=["1"],
        filter_string="status = 'OK'",
        max_results=100,
        page_token=page_token,
    )

    all_traces.extend(results)

    if not results.token:
        break
    page_token = results.token

print(f"Found {len(all_traces)} total traces")
Important Notes
MLflow Version Compatibility
DataFrame Schema: The format depends on the MLflow version used to call the search_traces API, not the version used to log the traces. MLflow 3.x uses different column names than 2.x.
Performance Tips
- Use timestamp filters to limit search space
- Limit max_results for faster queries when ordering
- Use pagination for large result sets
Backend Considerations
- SQL Store Backend: Supports the full search syntax documented above, including:
- All trace, span, metadata, tag, feedback, and expectation filters
- Pattern matching operators (LIKE, ILIKE, RLIKE)
- Full text search with
trace.text - Optimized performance with proper indexing on timestamp
- Local File Store: Limited search capabilities. May be slower with large datasets. Not recommended, only suitable for storing small number of traces.