Practical AI Observability: Getting Started with MLflow Tracing
MLflow Tracing: Observability for GenAI
GenAI providers and frameworks often respond with complicated and hard-to-read data structures or with simple responses that hide intermediate steps. Furthermore, it can be hard to keep track of and compare GenAI model/framework calls over time, especially if you are moving between frameworks and scripts.
MLflow's LLM tracing solves these issues by recording all of your GenAI calls, including both individual LLM calls and multi-step agentic workflows, and providing an easy-to-read interface for browsing and comparing them. You can enable this functionality for most GenAI providers with a single line of code: mlflow.<provider>.autolog().
This blog will show how to get started with MLflow tracing—in about five minutes. It assumes some familiarity with GenAI APIs (e.g. the OpenAI API), but does not assume any prior familiarity with MLflow.
Quickstart
We'll start by showing how to use MLflow autologging to automatically trace calls to OpenAI models, though MLflow supports automatic tracing for an ever-growing number of providers and frameworks including Anthropic, Ollama, Langchain, LlamaIndex, and may others. To get started, install the MLflow and OpenAI Python packages with:
pip install mlflow openai
Collecting Traces with Autologging
In a Python script or notebook, import MLflow and the GenAI provider you're working with, and enable tracing with mlflow.<provider>.autolog. Here's how to set up automatic tracing for OpenAI:
import mlflow
from openai import OpenAI

mlflow.openai.autolog()
Make sure to create and set your OpenAI API key! You can set it in your environment with
export OPENAI_API_KEY="your_api_key_here"
Now, when you use the OpenAI library, MLflow will capture traces of your model calls. For example, MLflow will log a trace of the following OpenAI invocation because we have enabled autologging.
client = OpenAI()

completion = client.chat.completions.create(
    model="gpt-4o-mini",
    messages=[
        {"role": "system", "content": "You are a helpful assistant."},
        {
            "role": "user",
            "content": "What is an MLflow tracking server?"
        }
    ]
)
Viewing your LLM Traces
The MLflow UI provides an AI observability dashboard for viewing your traces. Start the MLflow UI from your terminal with:
mlflow ui
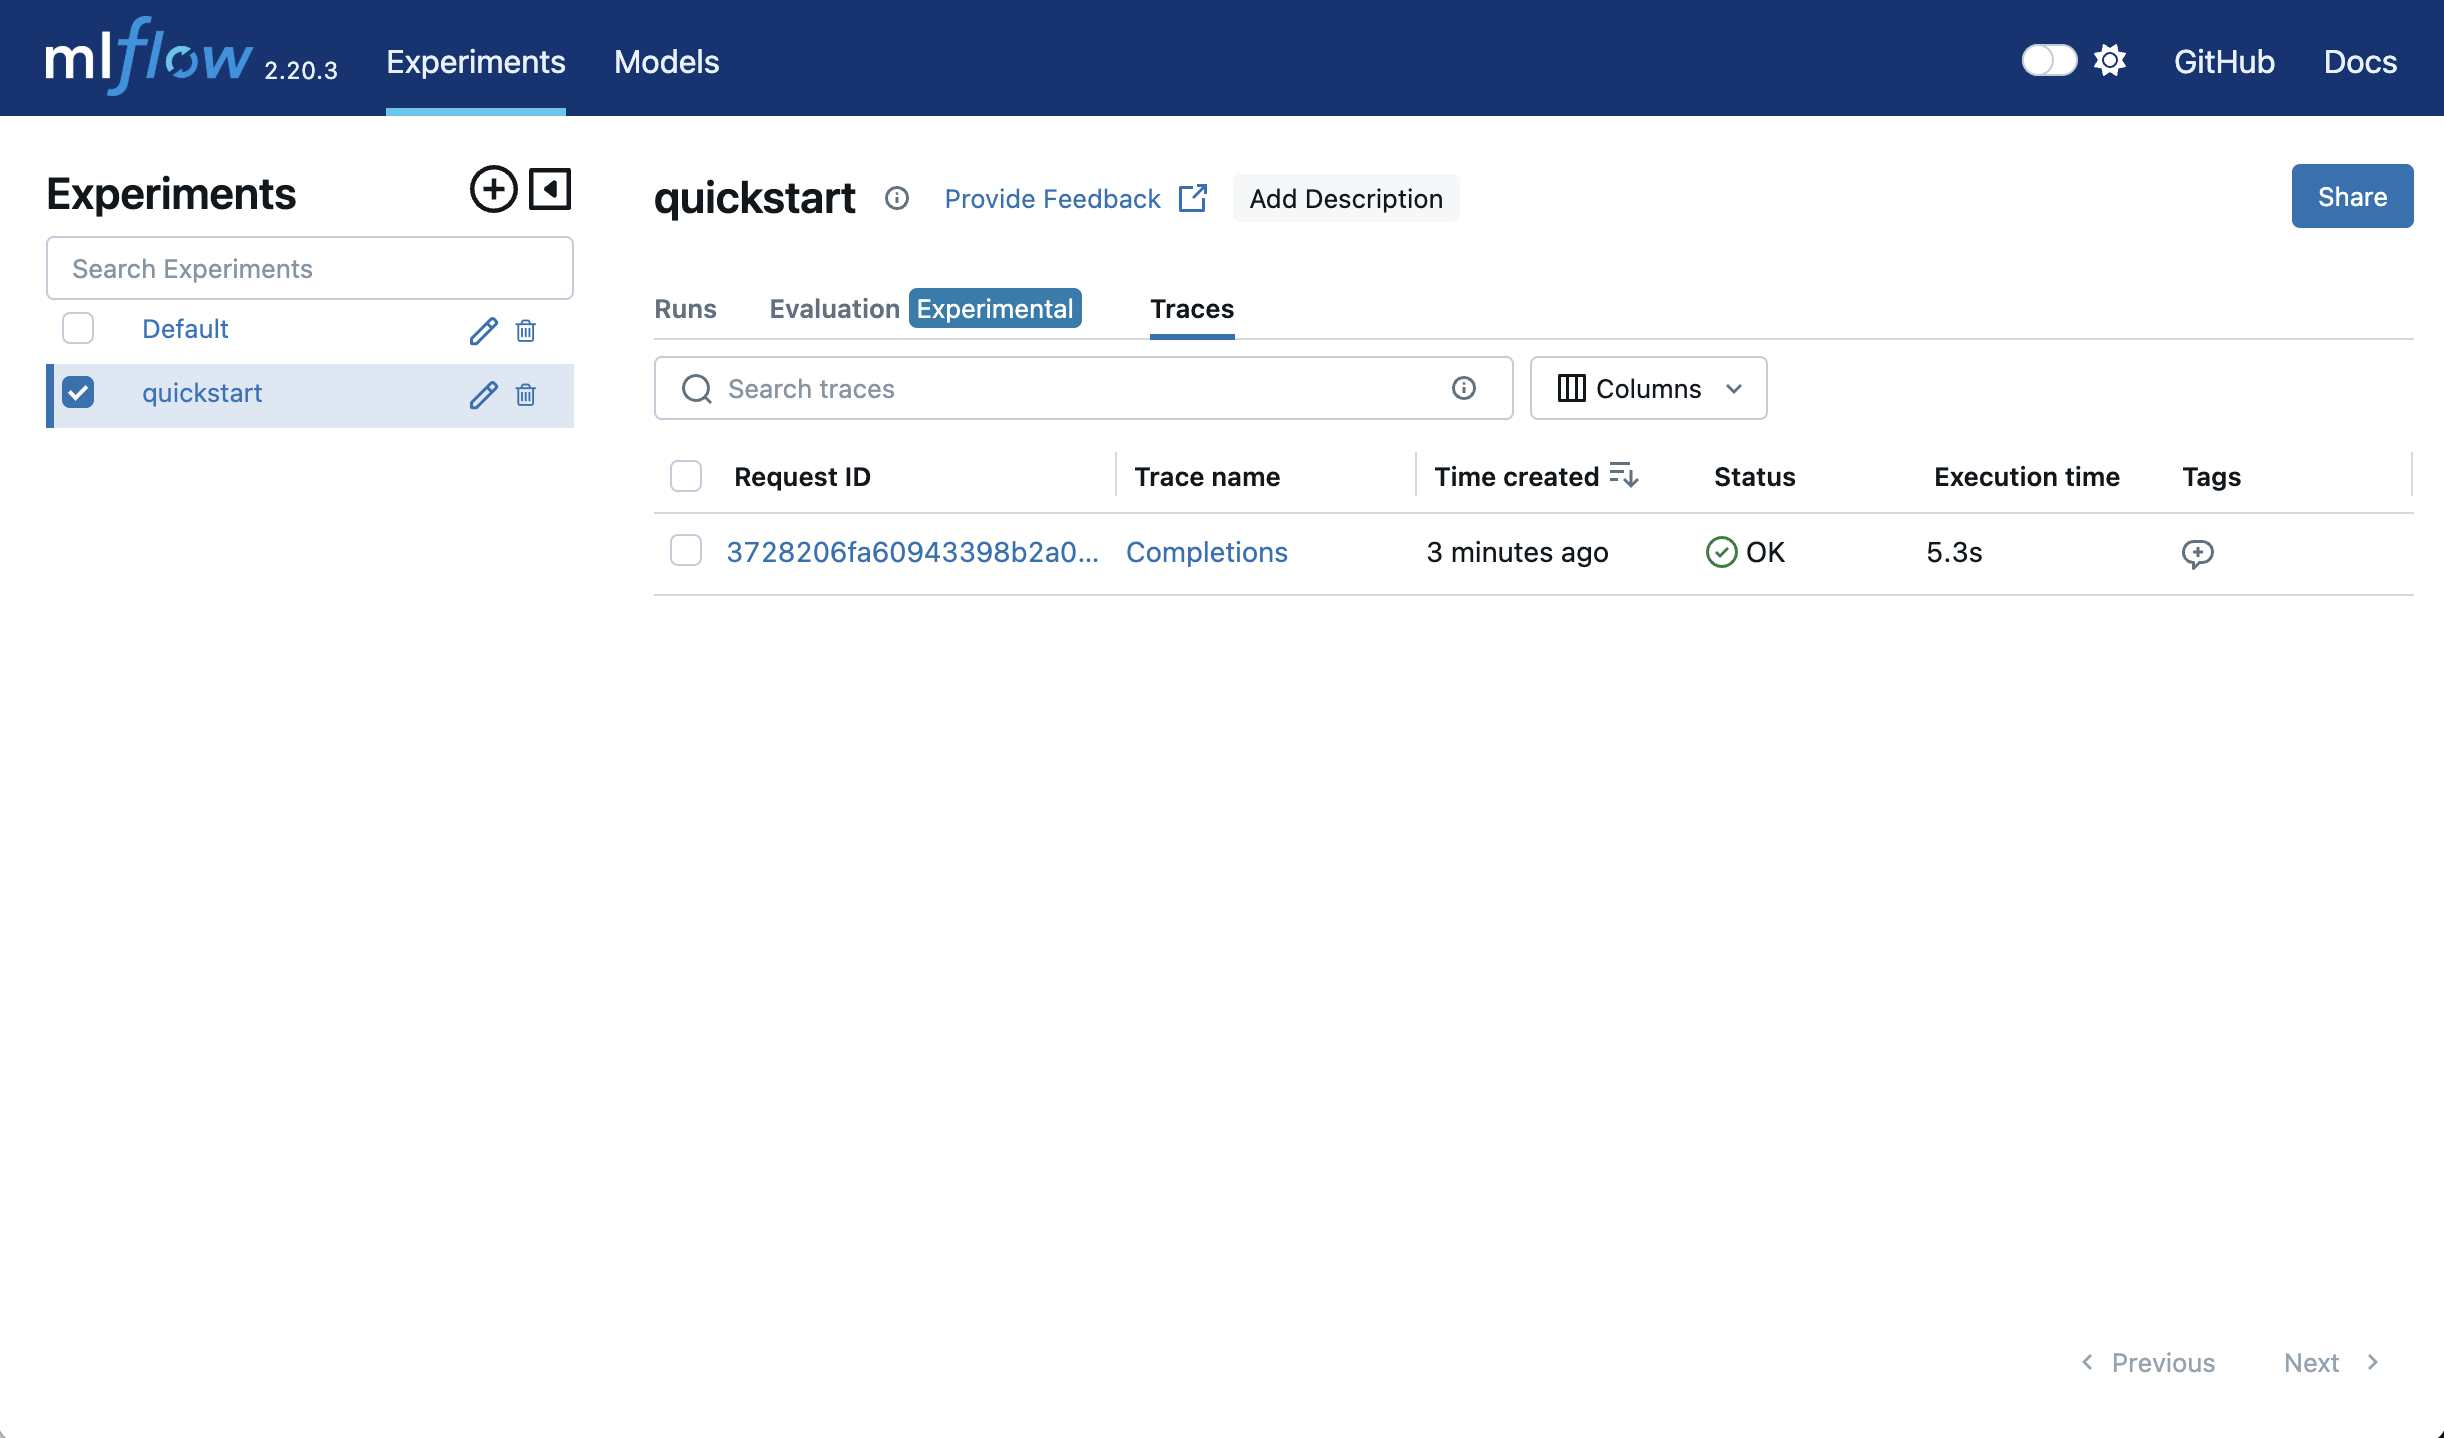
Navigate to the UI. the output of the mlflow ui command will tell you where to go (http://localhost:5000 by default). In the UI, navigate to the "Traces" tab. This will list all of the collected traces. Click on a trace's Trace ID to open up a new pane with more details.
By default, the MLflow server will listen on http://localhost:5000. You can choose a different port with mlflow ui -p <port>. For example, to listen on port 5001, use mlflow ui -p 5001.
Starting the MLflow tracking server with mlflow ui also enables you to view traces right in a Jupyter notebook! You just have to set the tracking uri to the location specified above:
mlflow.set_tracking_uri("http://localhost:5000")
Then, when you invoke an AI model/framework with tracing enabled, the generated trace(s) will appear right in the notebook outputs.
You can disable this functionality with mlflow.tracing.disable_notebook_display().
Organizing your Traces
If you use tracing across multiple different projects and tasks, you might want to organize the traces into separate groups.
The easiest way to organize your traces is to separate them into experiments. Each experiment has its own traces tab, which displays the traces for that experiment.
You can create an experiment in the UI (With the "+" button next to "Experiments"), with the MLflow CLI, or with Python. Let's create a new experiment called "Quickstart" and log a trace.
mlflow.set_experiment("quickstart")

completion = client.chat.completions.create(
    model="gpt-4o-mini",
    messages=[
        {"role": "system", "content": "You are a helpful assistant."},
        {
            "role": "user",
            "content": "What is an MLflow tracking server?"
        }
    ]
)
We can now find this trace in the "Traces" tab in the "quickstart" experiment.
The set_experiment function specifies which experiment traces should be logged to, creating it if it does not exist, so the code snippet above created a new "quickstart" experiment.
You can also organize your traces with tags and runs.
Tracing Other Providers
Our quickstart example focused on OpenAI, but MLflow supports automatic tracing of many different AI providers and frameworks. The approach is the same: just add the line mlflow.<provider>.autolog to your notebook or script.
Here are a few examples. See here for the full list of supported providers.
- Anthropic
- LangChain
- Ollama
Enable automatic tracing for Anthropic model calls with mlflow.anthropic.autolog().
import anthropic
import mlflow

mlflow.anthropic.autolog()

client = anthropic.Anthropic()

message = client.messages.create(
    model="claude-3-7-sonnet-20250219",
    max_tokens=1000,
    temperature=1,
    messages=[
        {
            "role": "user",
            "content": "What is an MLflow tracking server?"
        }
    ]
)
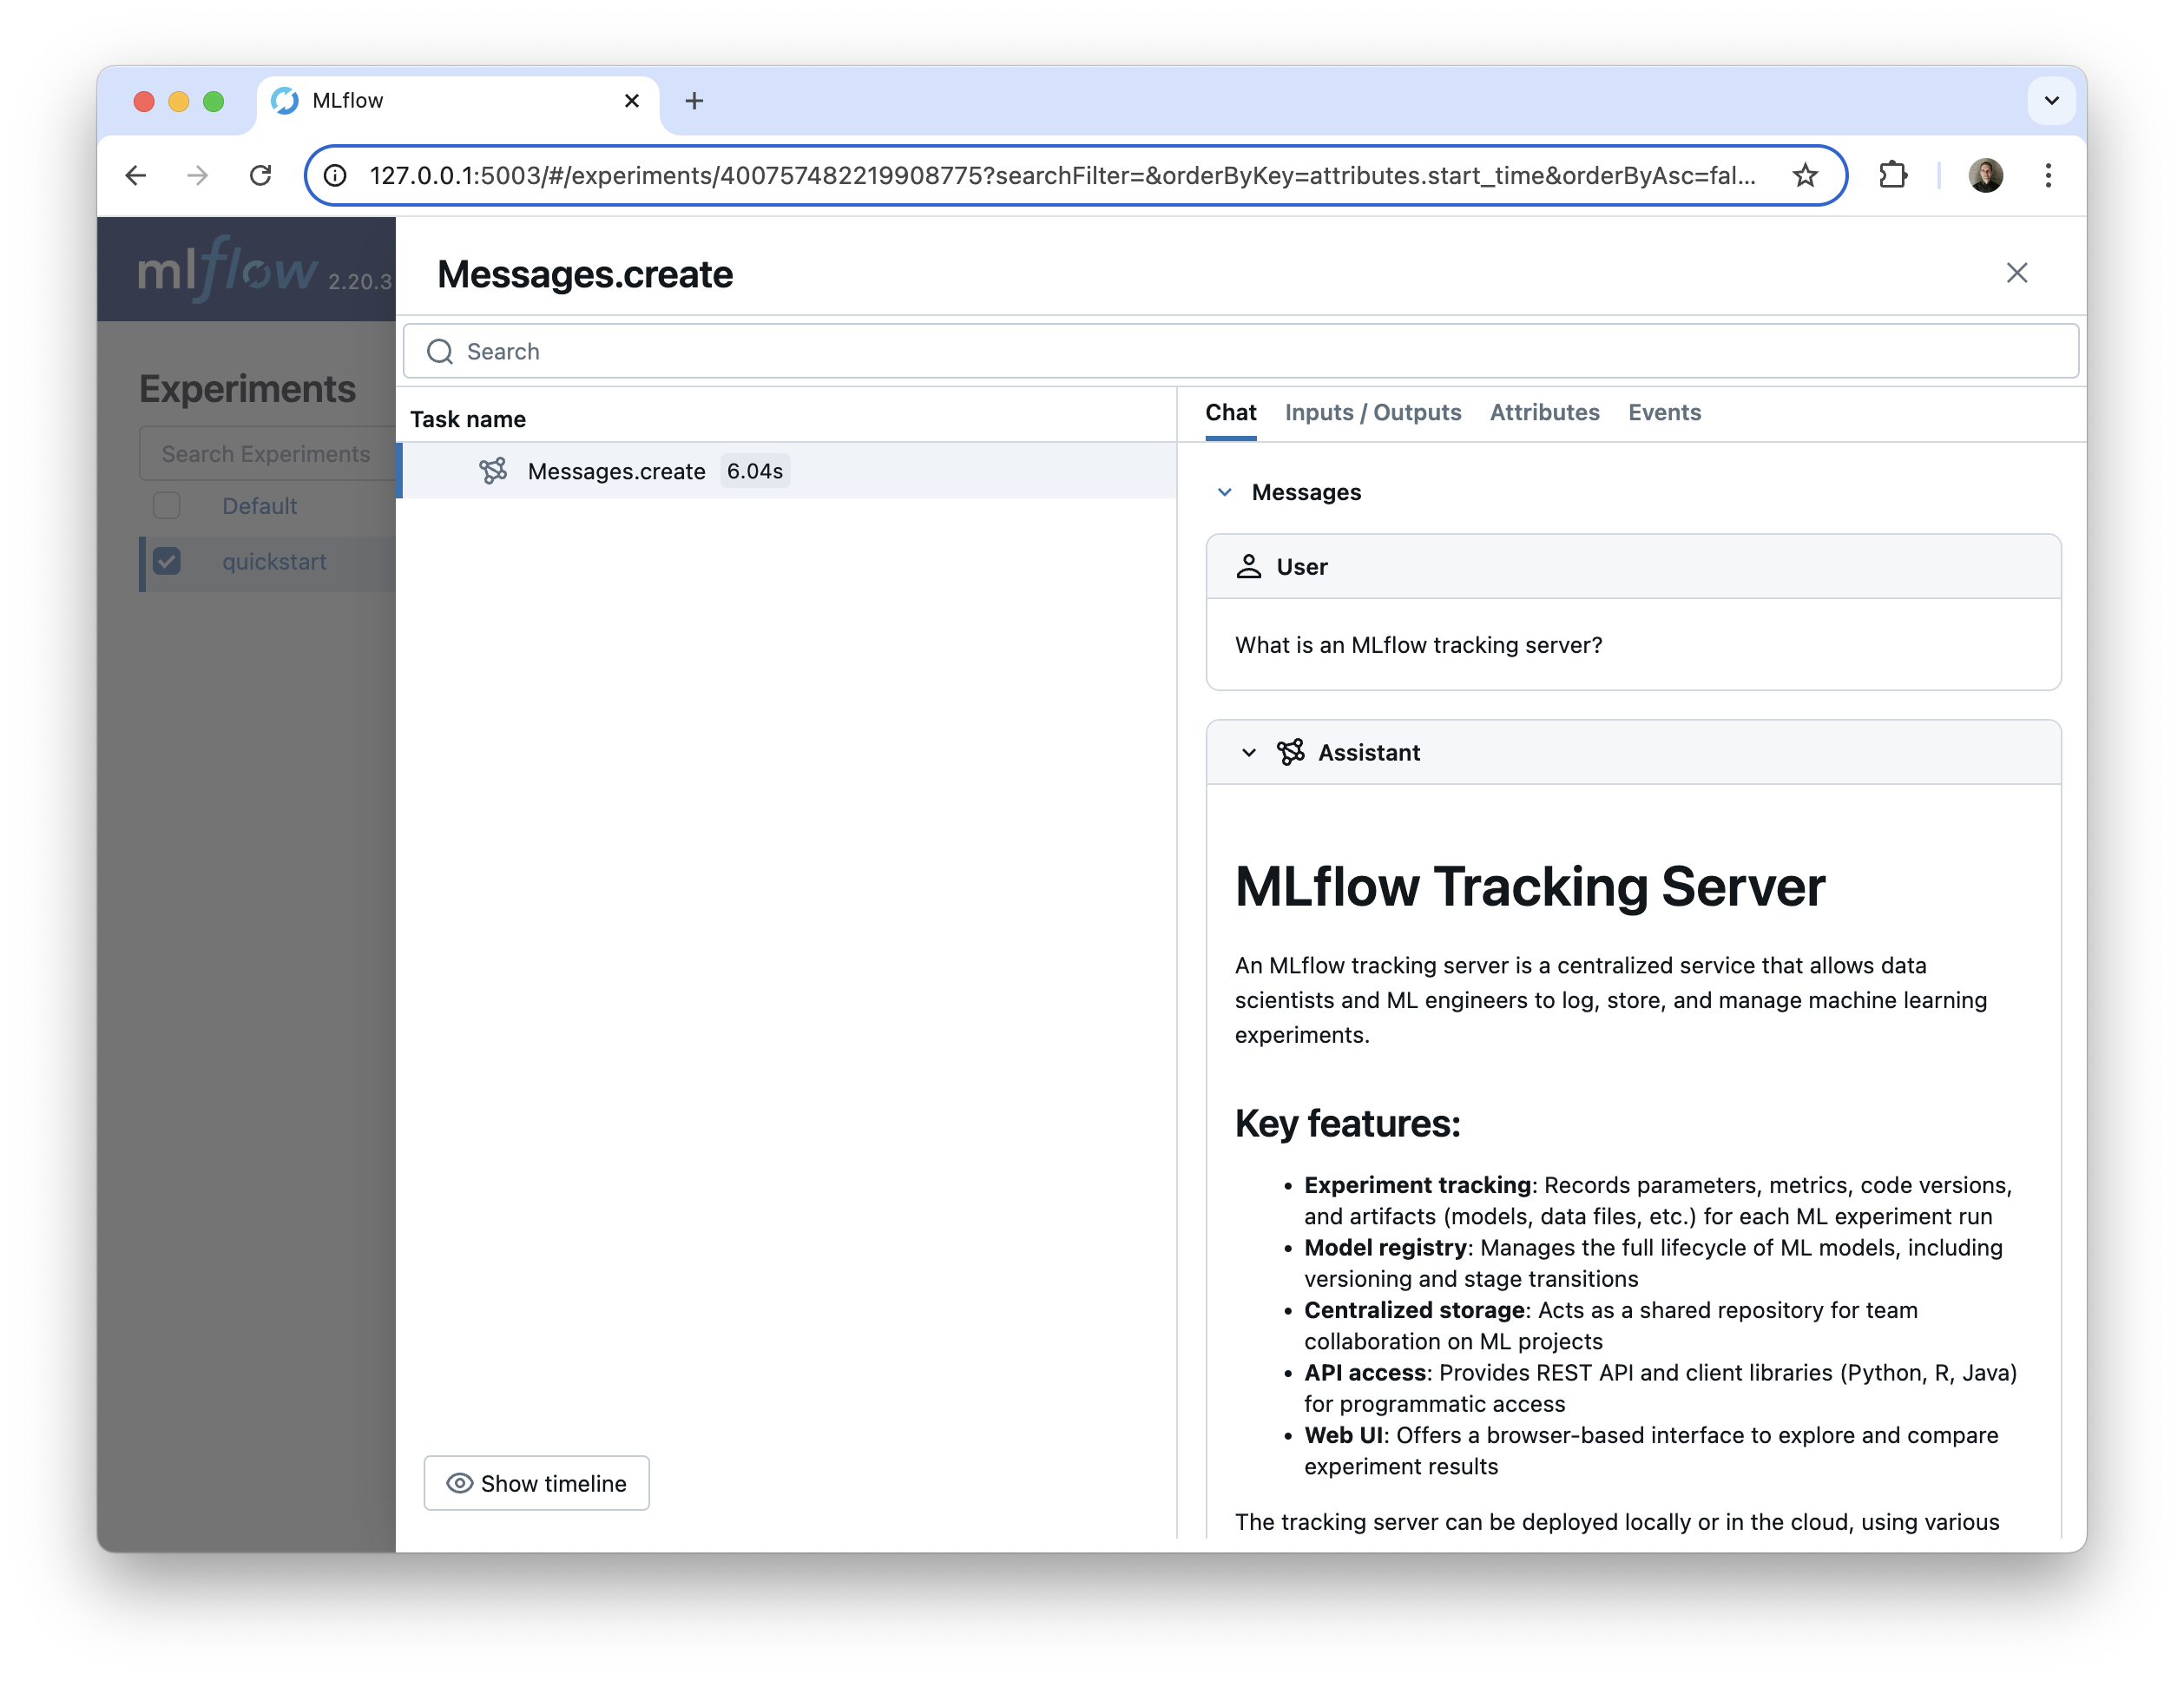
This returns the following in the MLflow UI:
Enable automatic tracing for LangChain and LangGraph with mlflow.langchain.autolog(). MLflow automatic tracing captures all LangChain component executions, including chains, LLMs, agents, tools, prompts, and retrievers.
import mlflow

from langchain.prompts import PromptTemplate
from langchain_core.output_parsers import StrOutputParser
from langchain_openai import ChatOpenAI

mlflow.set_experiment("quickstart")

mlflow.langchain.autolog()

llm = ChatOpenAI(model="gpt-4o-mini", temperature=1, max_tokens=500)

prompt_template = PromptTemplate.from_template(
    "Explain the following MLflow concept at the specified technical level. "
    "For 'beginner', use simple analogies and avoid complex terms. "
    "For 'intermediate', include more technical details and some code examples. "
    "For 'advanced', go deep into implementation details and provide comprehensive explanations. "
    "Technical level: {level}. Question: {question}"
)

chain = prompt_template | llm | StrOutputParser()

chain.invoke(
    {
        "level": "beginner",
        "question": "How do MLflow tracking servers help with experiment management?",
    }
)
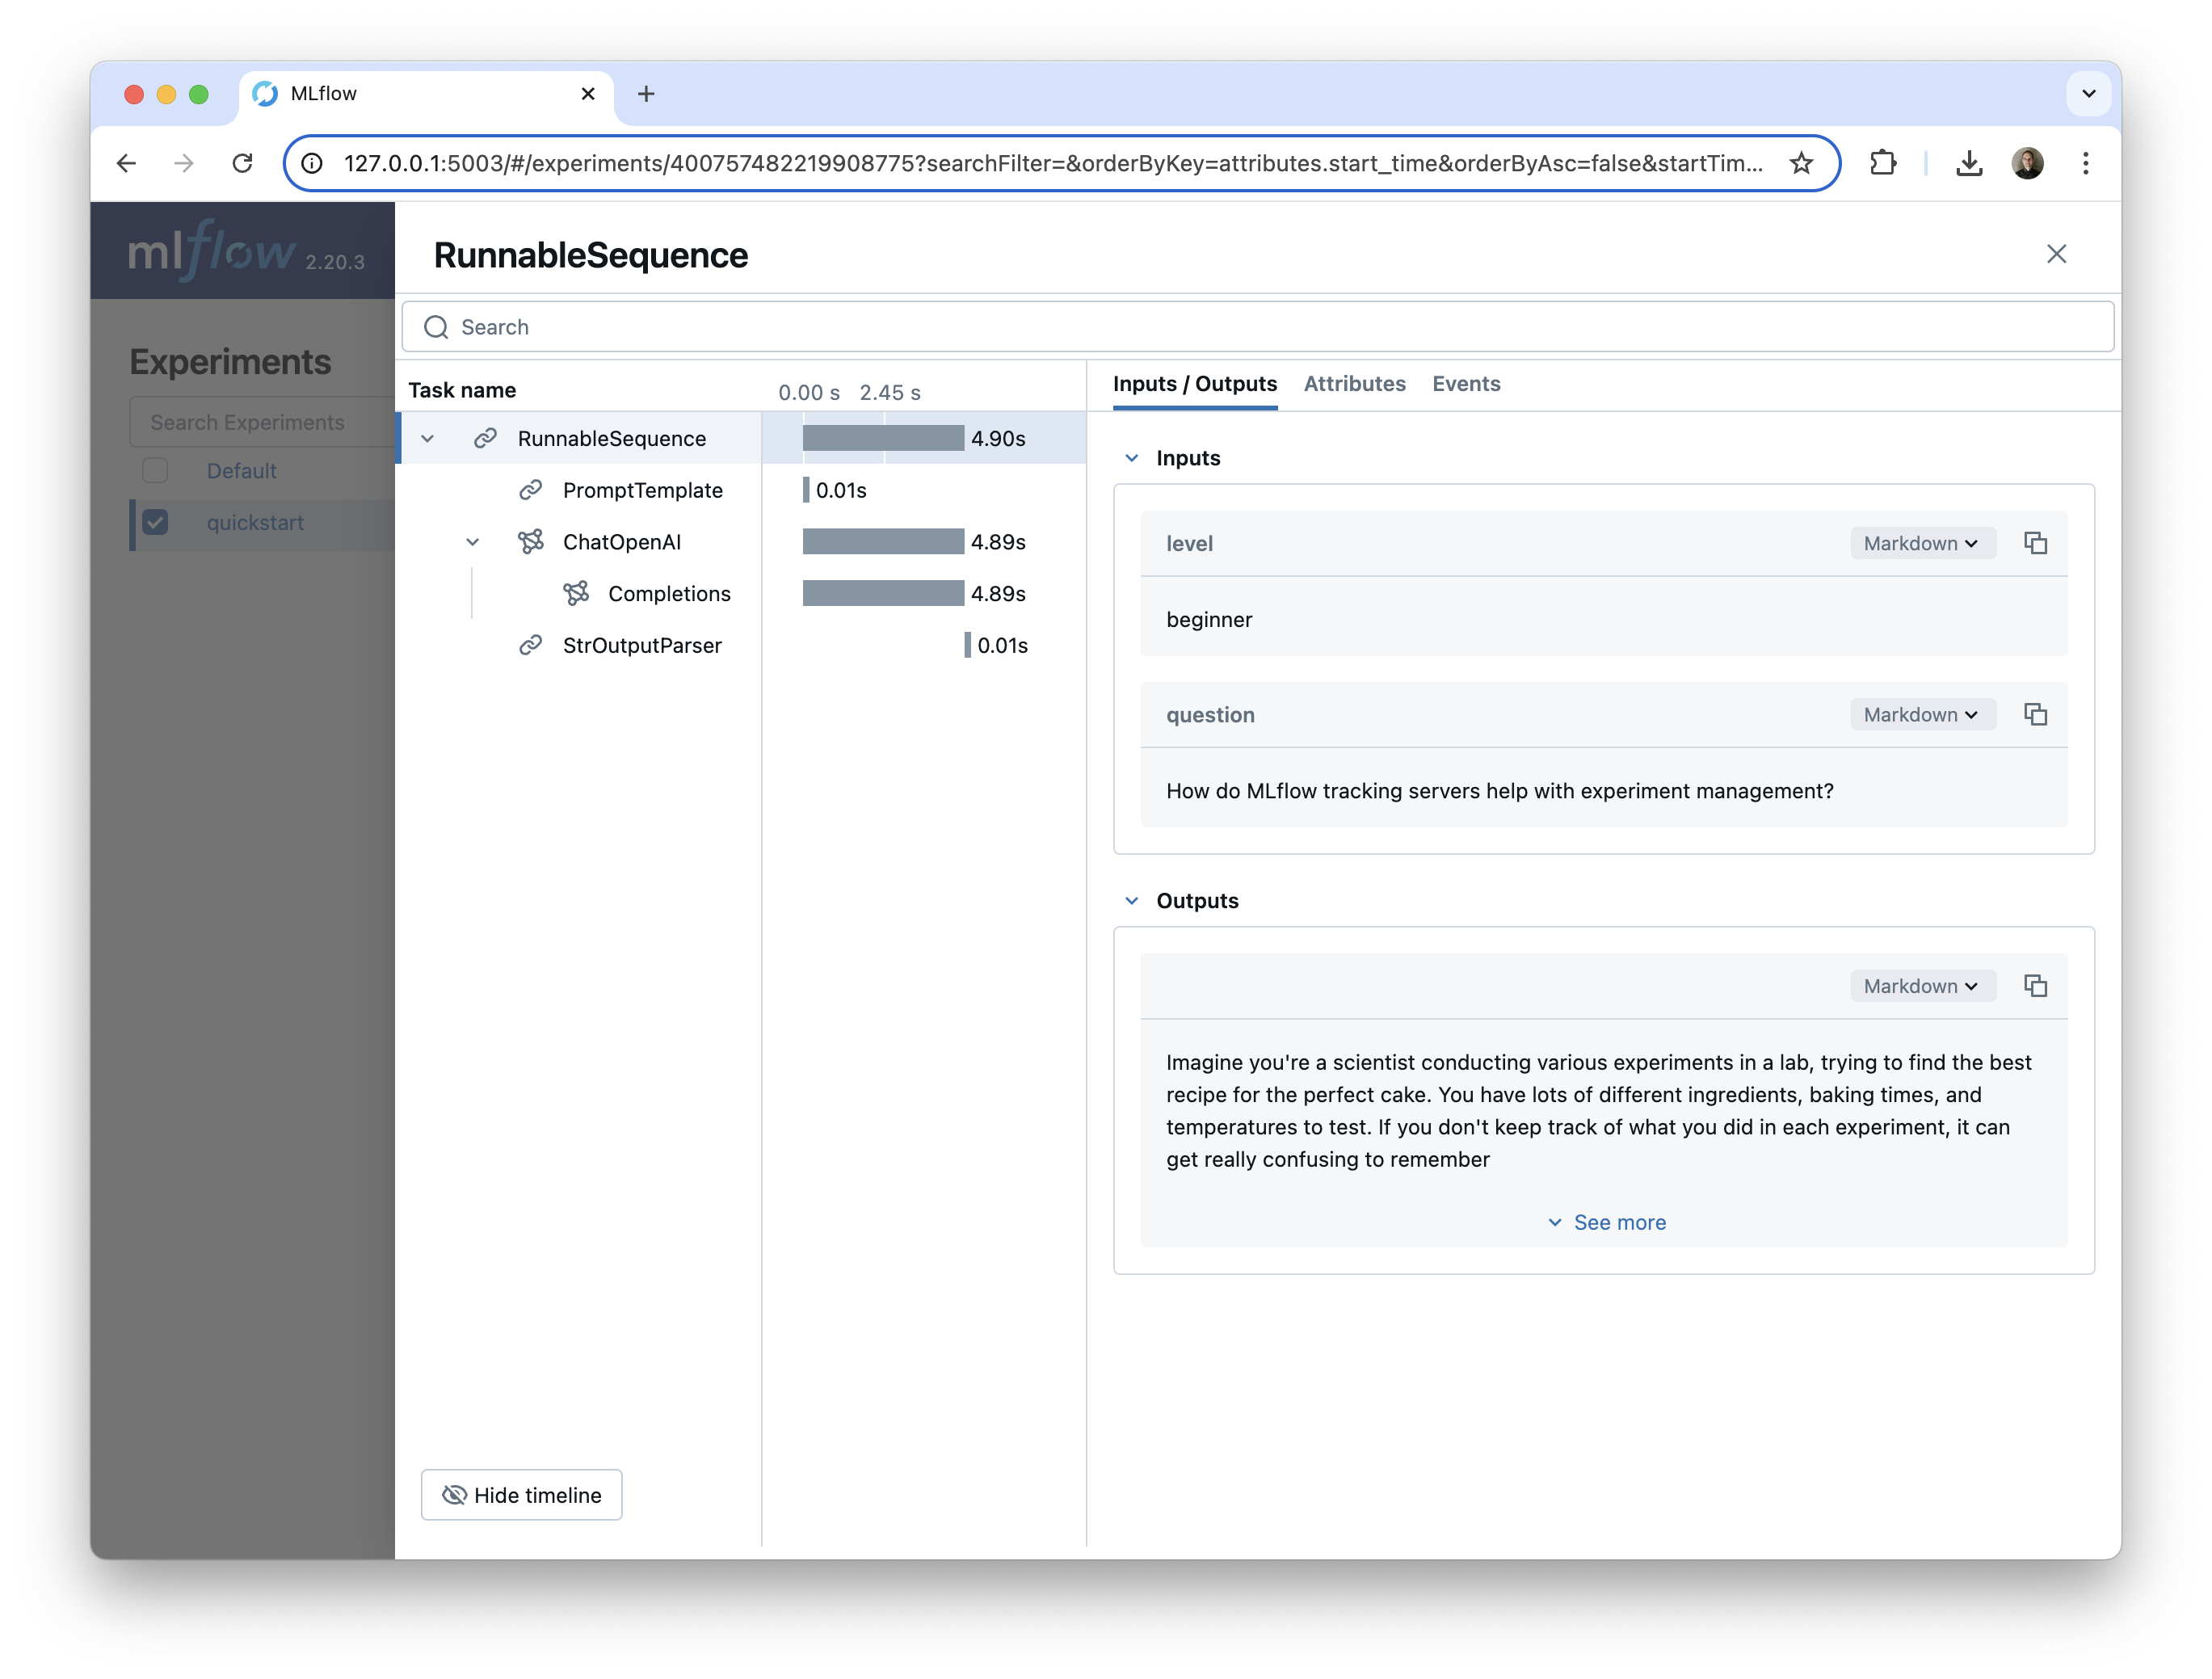
This example LangChain chain includes multiple components:
- The
PromptTemplate, which assembles the prompt based on the user input - The
ChatOpenAImodel, which is used to call the OpenAIgpt-4o-minimodel - The
StrOutputParser, which returns the final answer to the user's query as a string
We can see each of these components in the MLflow UI, nested under the parent RunnableSequence chain.
Ollama is a tool for running open source AI models locally. You can enable automatic tracing of Ollama models via Ollama's OpenAI-compatible API and MLflow's OpenAI autologging. You just need to set the base URL to your Ollama REST endpoint.
This pattern should work with any provider that offers an OpenAI-compatible endpoint, even those that are not explicitly referenced in the docs.
Here's how it works for Ollama:
- First, run the Ollama server with your desired model.
ollama run phi3:latest
- Configure the OpenAI client, setting the
base_urlto the Ollama OpenAI-compatible endpoint.
from openai import OpenAI

client = OpenAI(
    base_url="http://localhost:11434/v1",  # The local Ollama REST endpoint
    api_key="dummy",  # Required to instantiate OpenAI client, it can be a random string
)
- Enable MLflow OpenAI autologging and query the model
mlflow.openai.autolog()

completion = client.chat.completions.create(
    model="phi3:latest",
    messages=[
        {"role": "system", "content": "You are a helpful assistant."},
        {"role": "user", "content": "What is an MLflow tracking server?"}
    ]
)
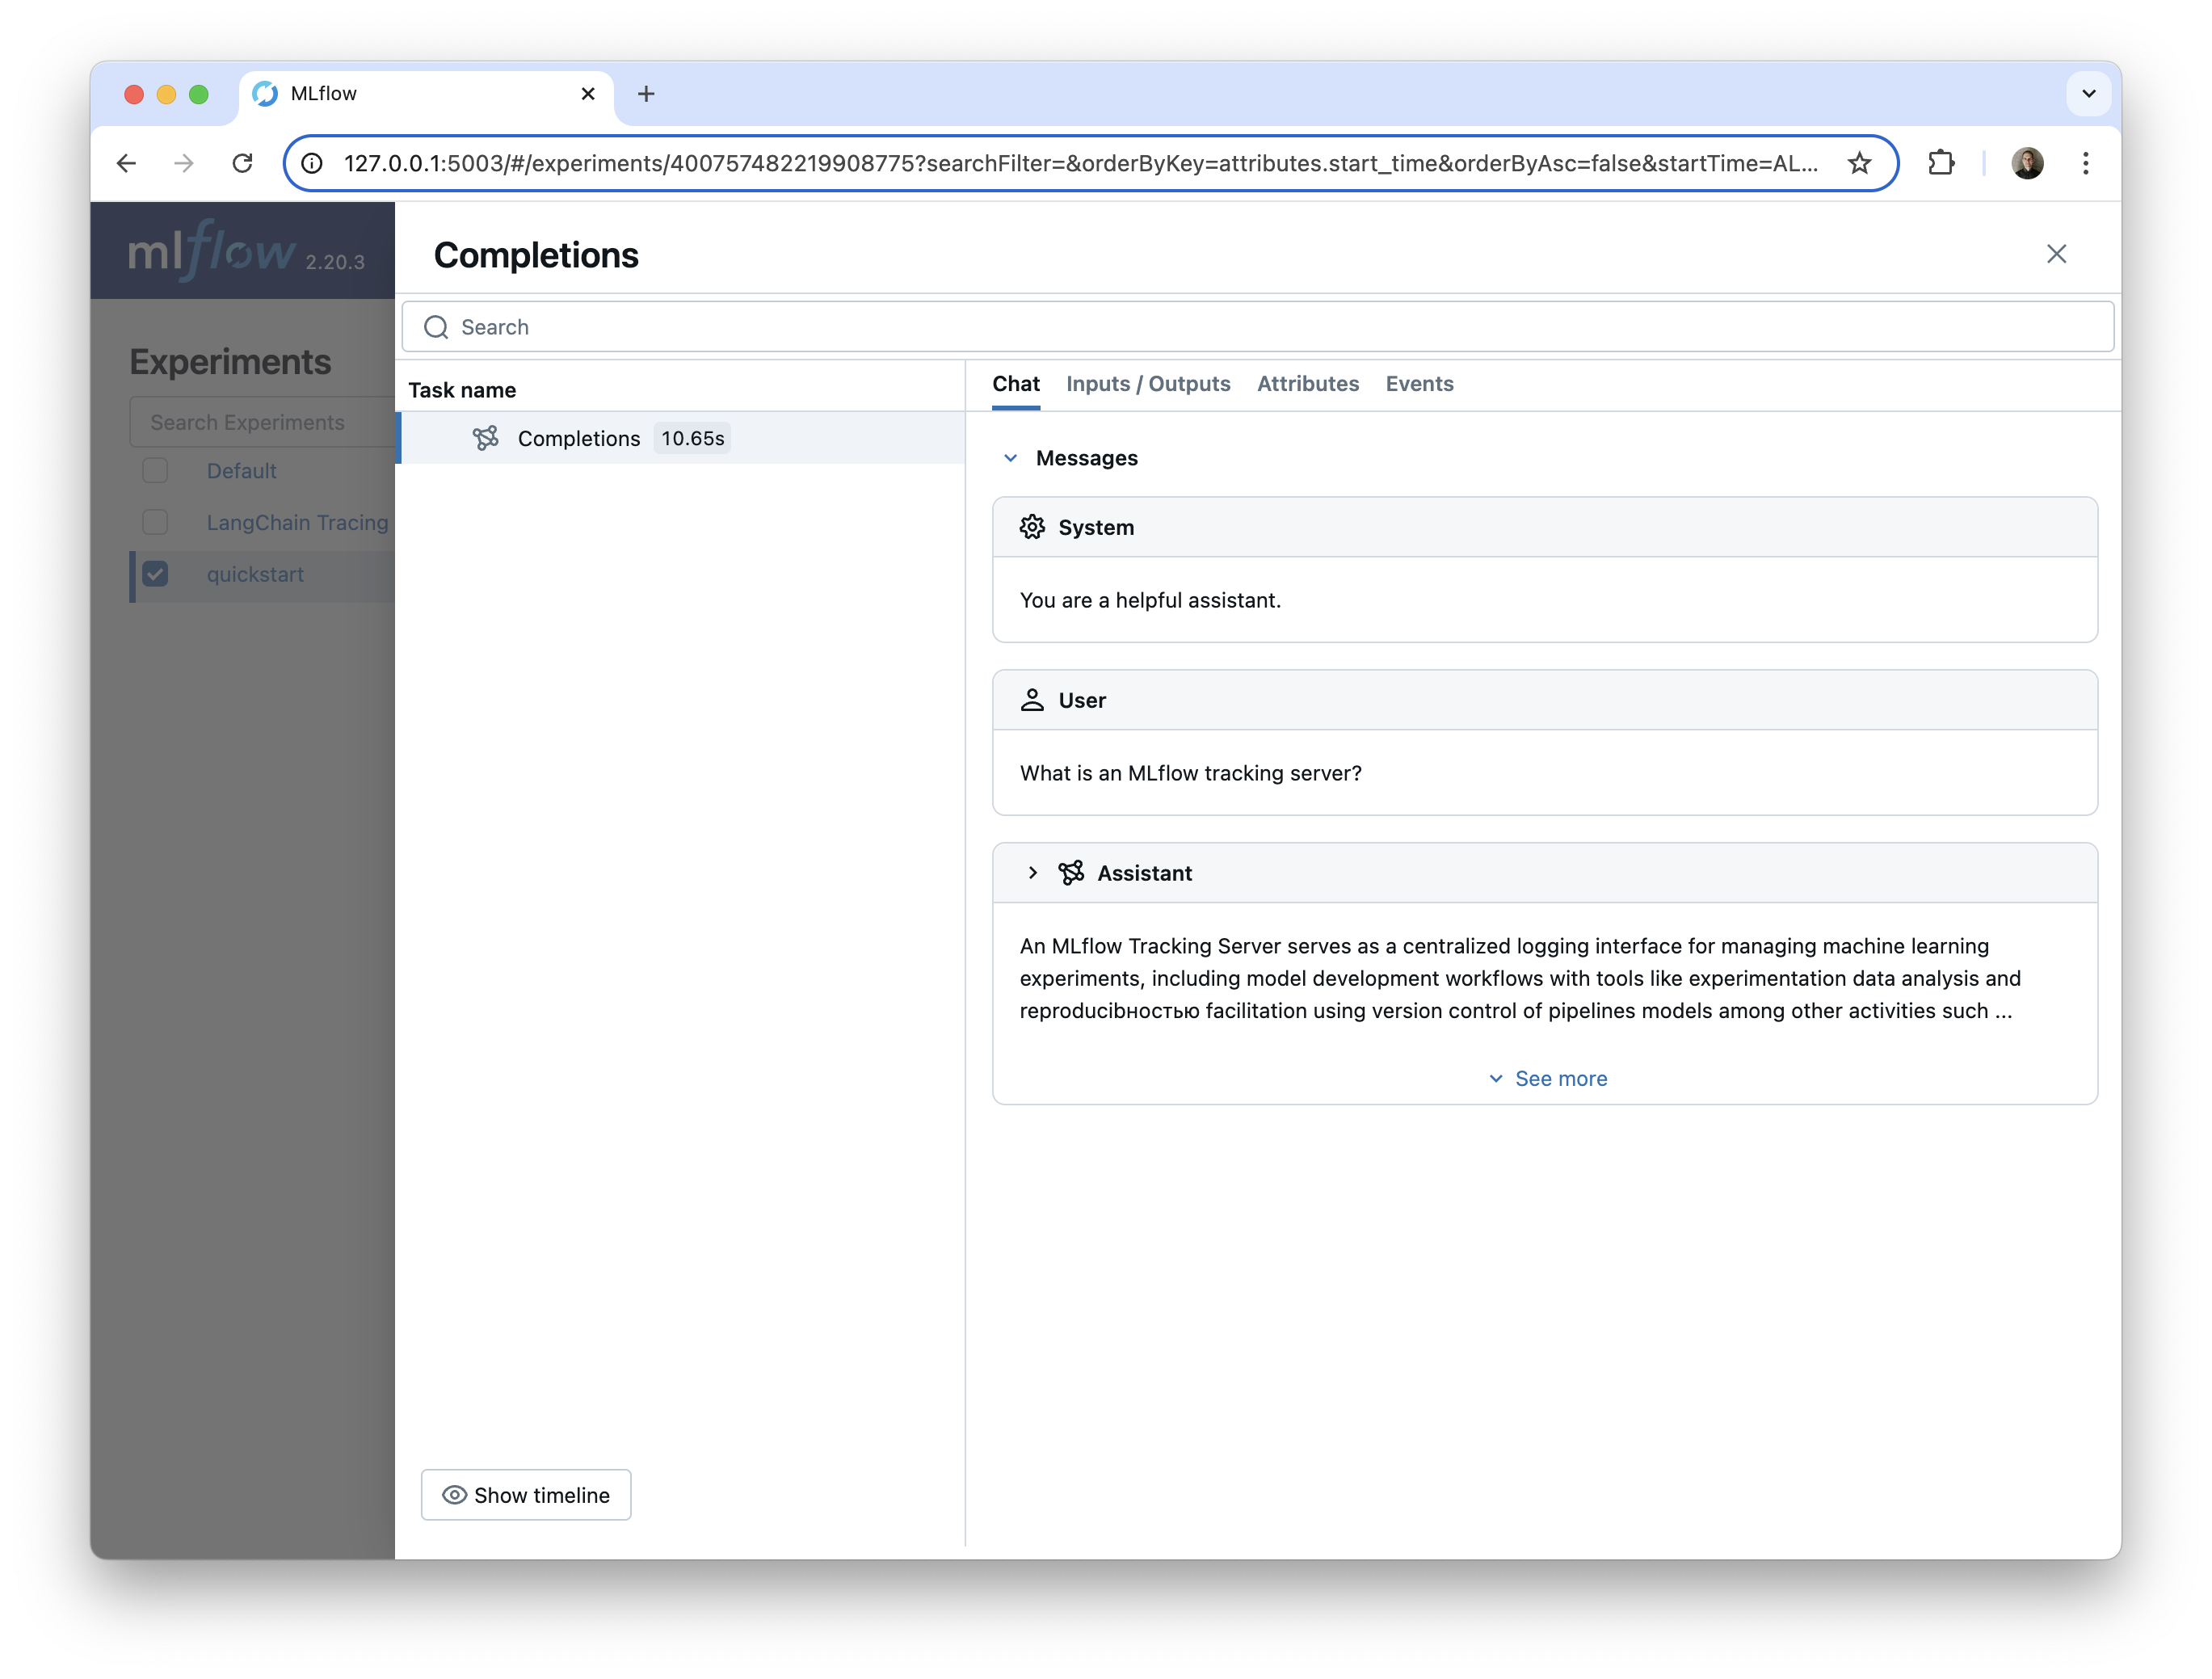
Here is the trace of the Ollama model call in the MLflow UI.
Conclusion: Effective LLM tracing with one line of code
In this guide, you have learned how to use MLflow's autologging capabilities to get a complete AI observability solution with a single line of code. If you are using one of the many GenAI frameworks/providers for which MLflow offers automatic tracing—including any providers with OpenAI-compatible endpoints—automatic logging is the easiest way to visualize and debug your AI application behavior. All you need is mlflow.<provider>.autolog().
Next Steps
Autologging is a great place to start with MLflow tracing, but you may need more flexibility in how you collect and use traces as you develop more complex GenAI applications. Furthermore, MLflow includes many tools for working with GenAI applications beyond tracing.
- For a longer conceptual introduction to tracing, read this guide on tracing concepts.
- MLflow traces can provide an excellent source of data for evaluation, SME review, fine-tuning, and more. Learn about searching and retrieving trace data here.
- MLflow provides LLM evaluation functionality for running structured experiments with your AI models and applications.
- You can add tracing to your own AI applications with the tracing fluent APIs and client APIs. You can also add tracing to libraries and frameworks that do not (yet) have autologging support.