Observability
Observability for AI apps
Gain visibility into your app's logic to debug issues, improve quality and attach metadata to help you understand user behavior.
Best-in-class tracing
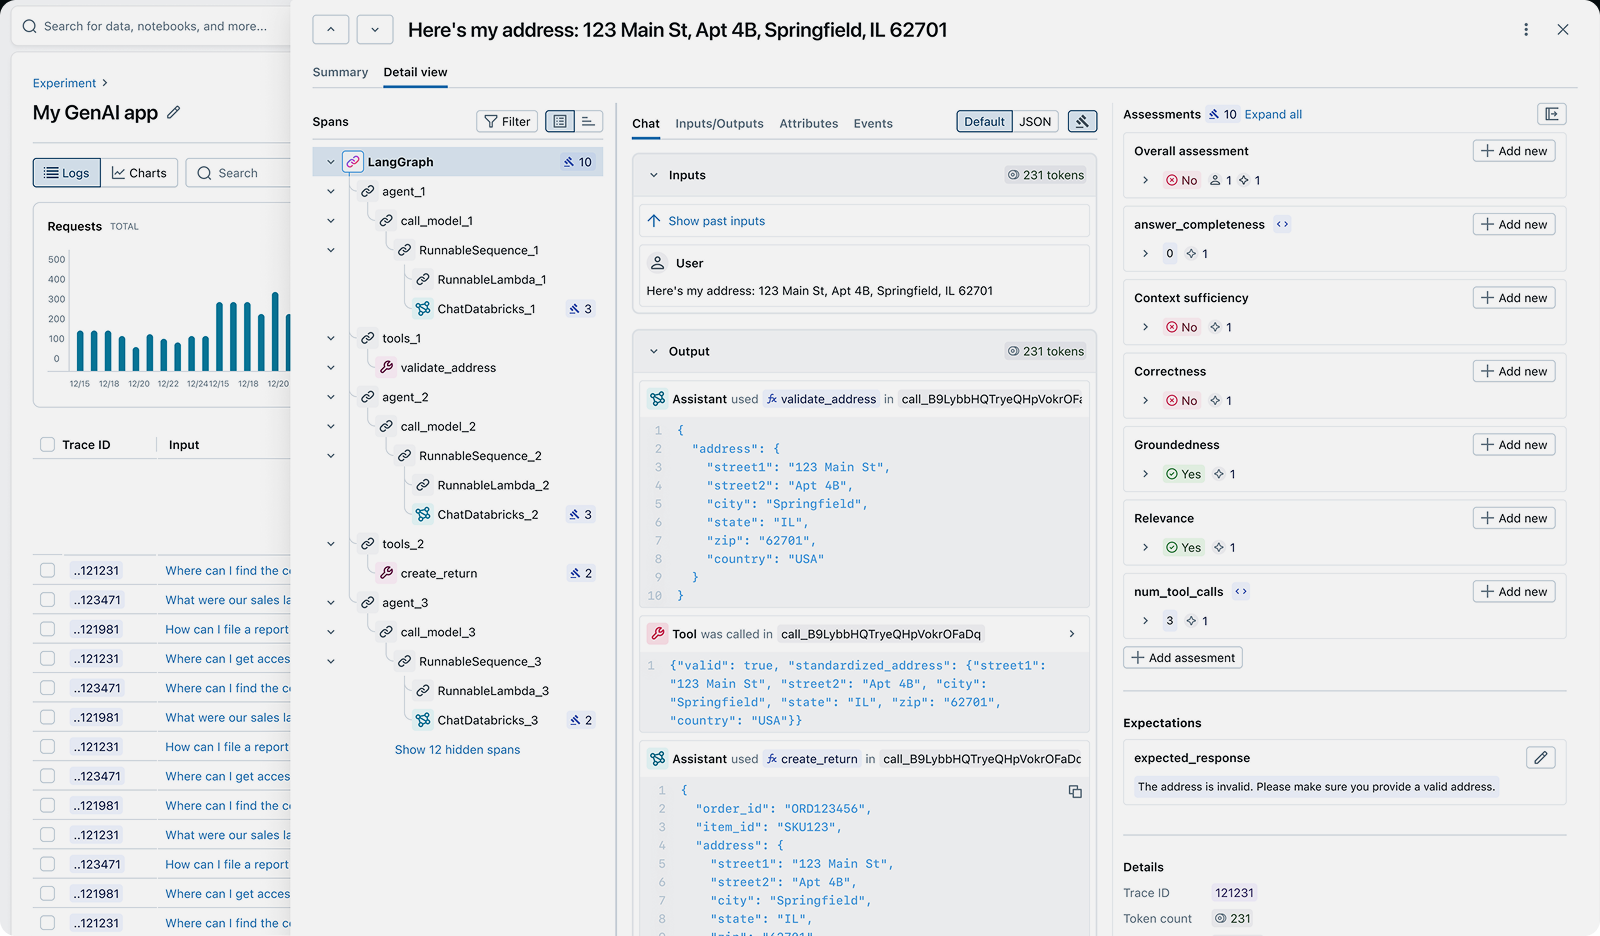
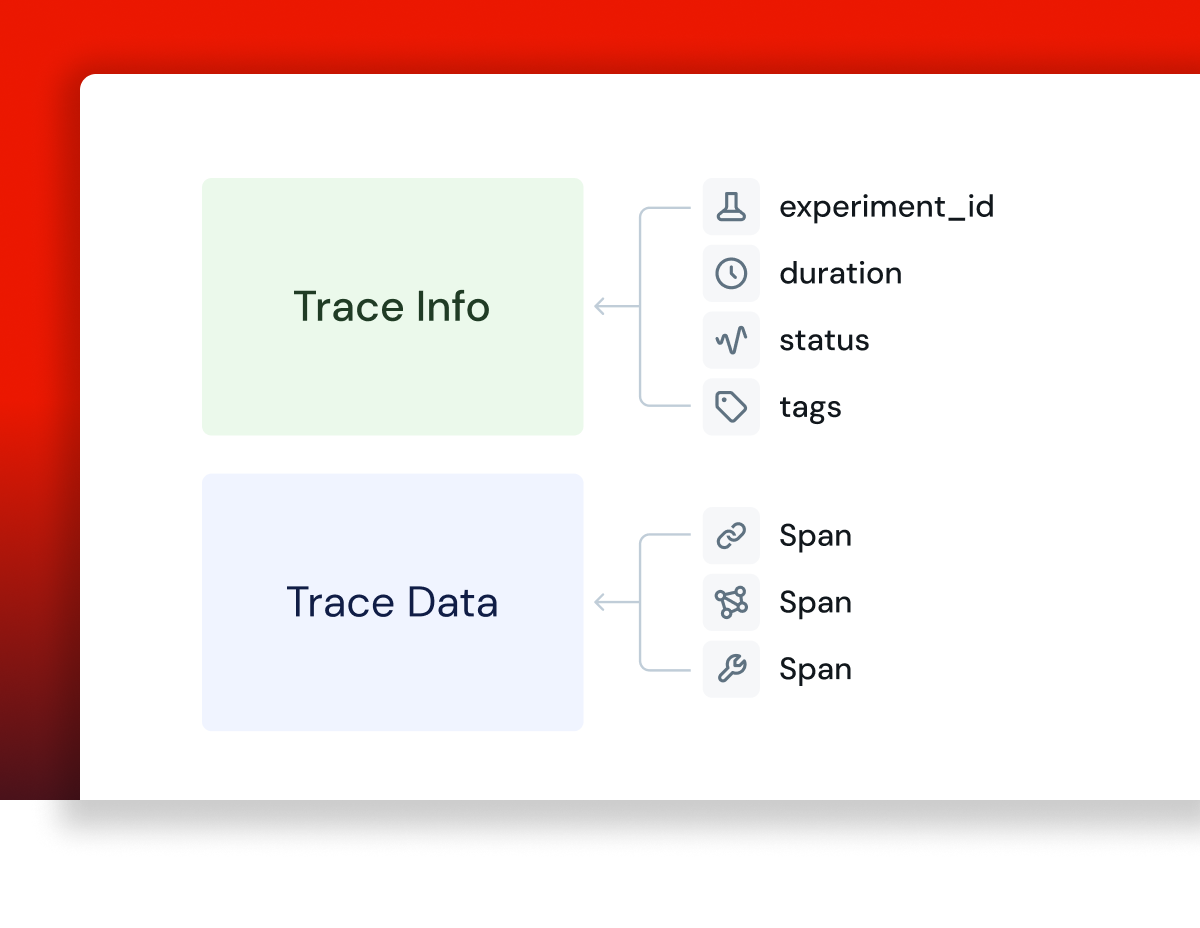
End to end observability
Capture your app's inputs, outputs, and step-by-step execution: prompts, retrievals, tool calls, and more.
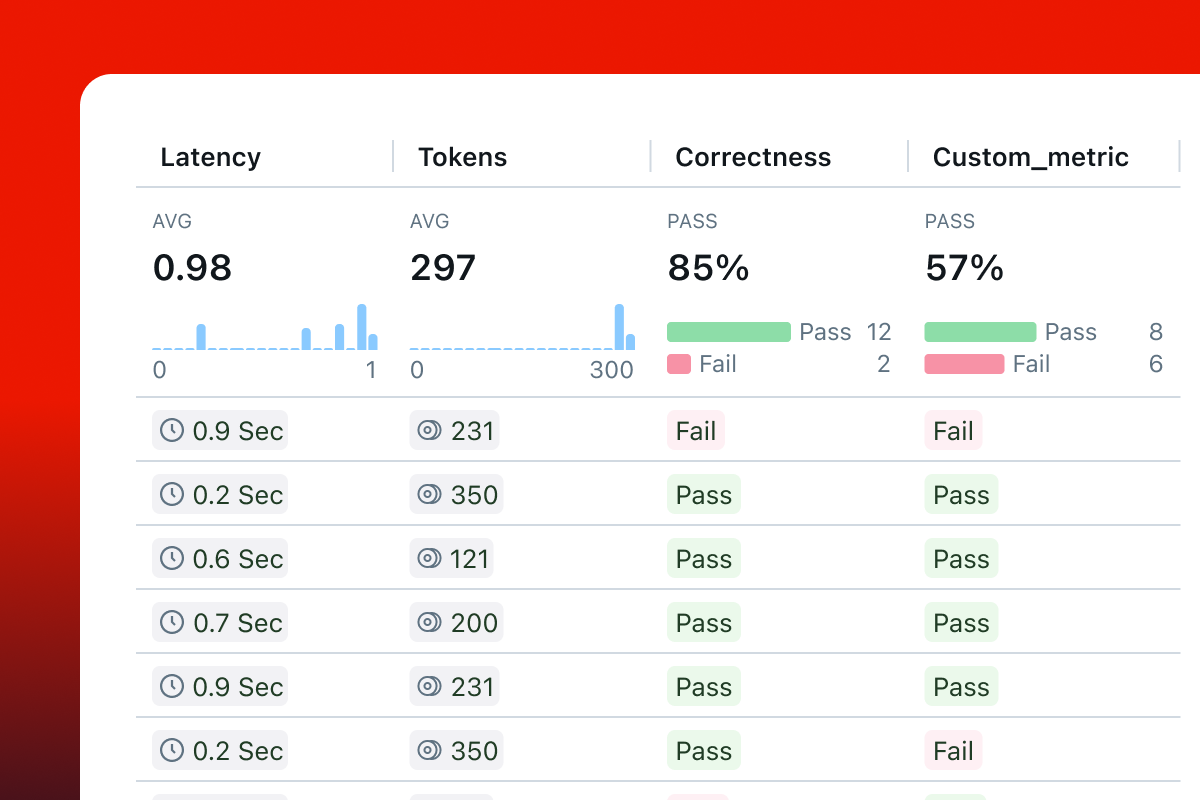
Cost & latency tracking
Track cost and latency for each step of your app's execution.
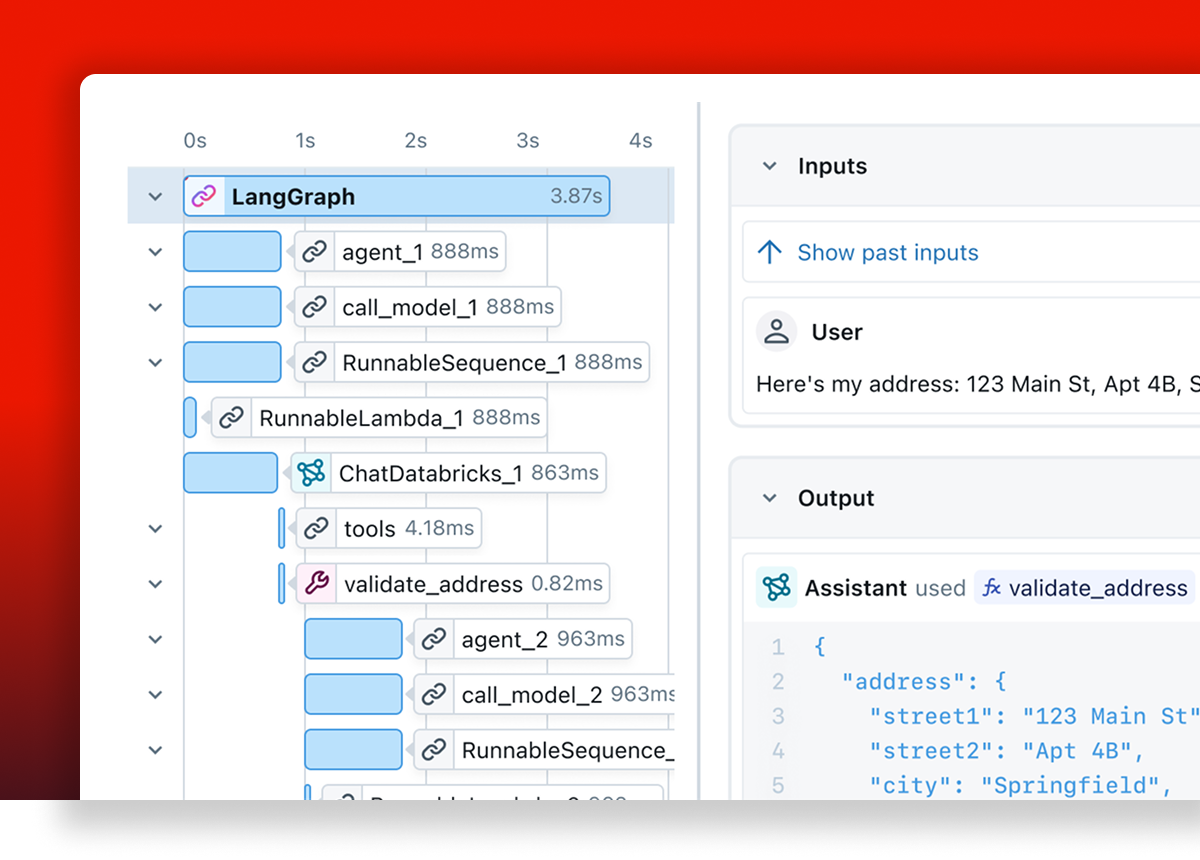
Visualize your app's execution flow
Deep dive into your app's logic and latency with an intuitive UI for effective debugging.
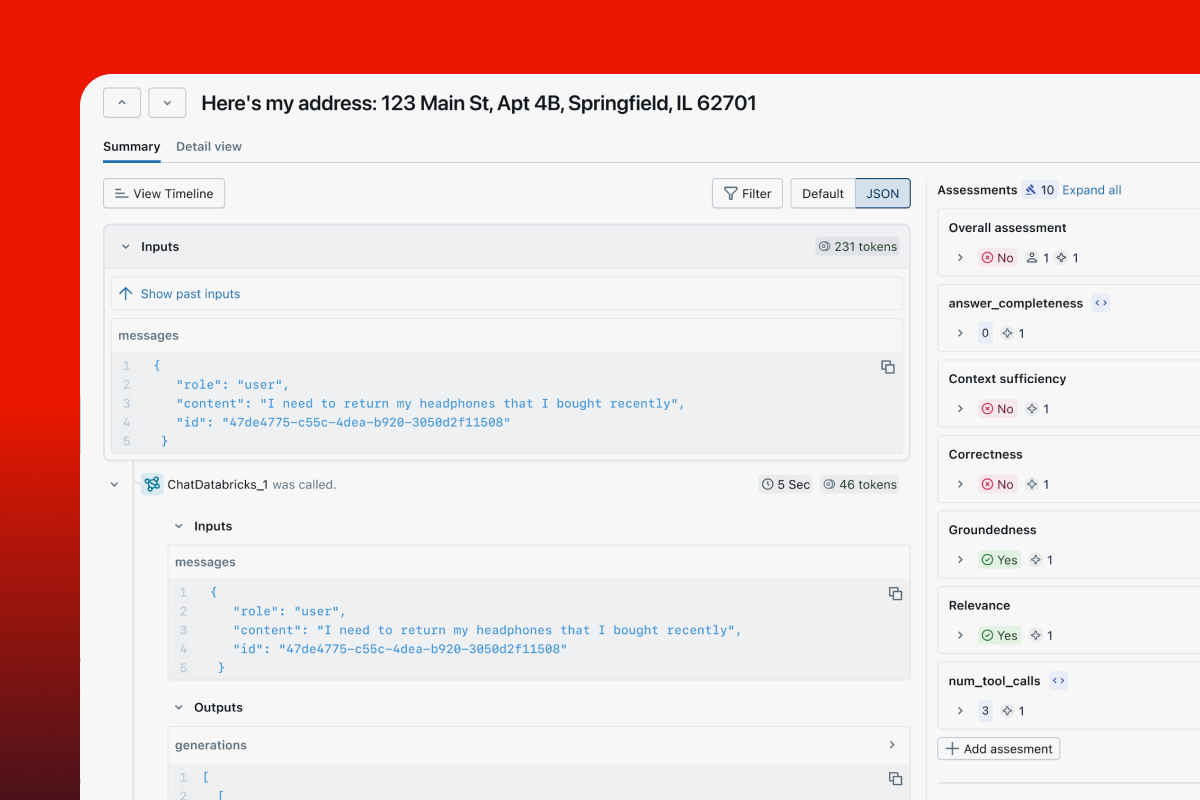
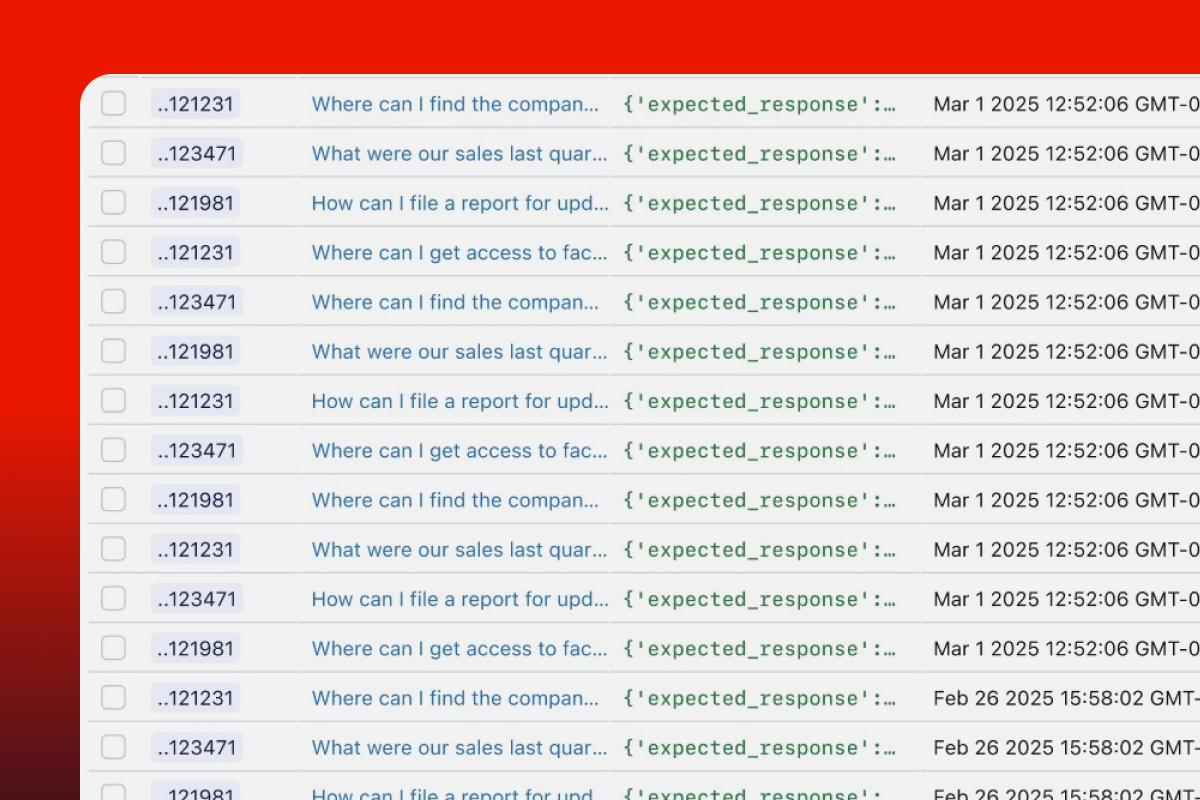
Quickly understand many traces
Zoom out with a simplified summary UI to quickly review many traces at once to understand how your app processes user requests.
Simple, customizable instrumentation
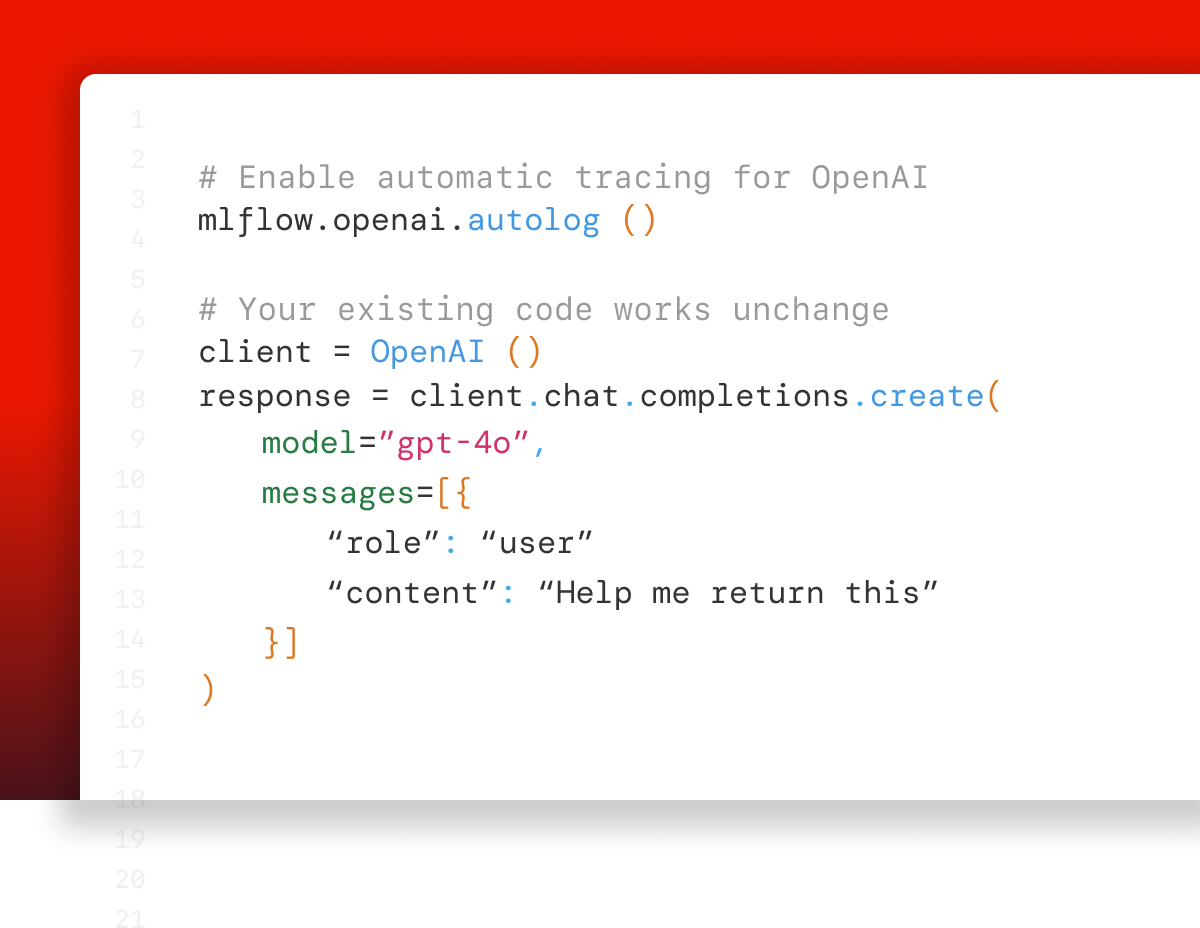
Automatic instrumentation that's fully customizable
Instrument your app with 1-line-of-code integrations for over 20 popular LLM SDKs and generative AI frameworks. Optionally, use our intuitive APIs to customize the integrations.
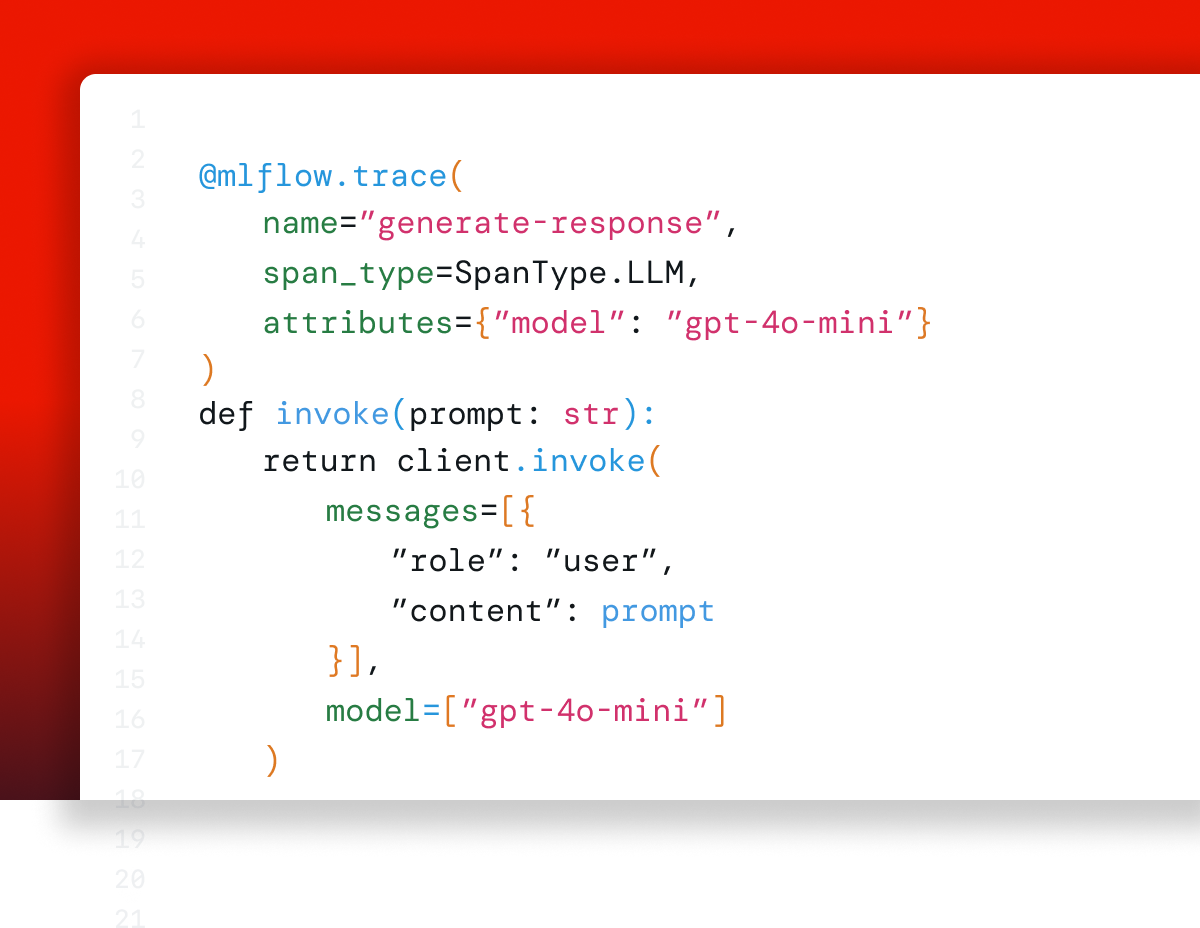
SDKs for custom instrumentation
Use our intuitive SDK - decorators, context managers, and low-level APIs - to trace custom code or customize the integrations.
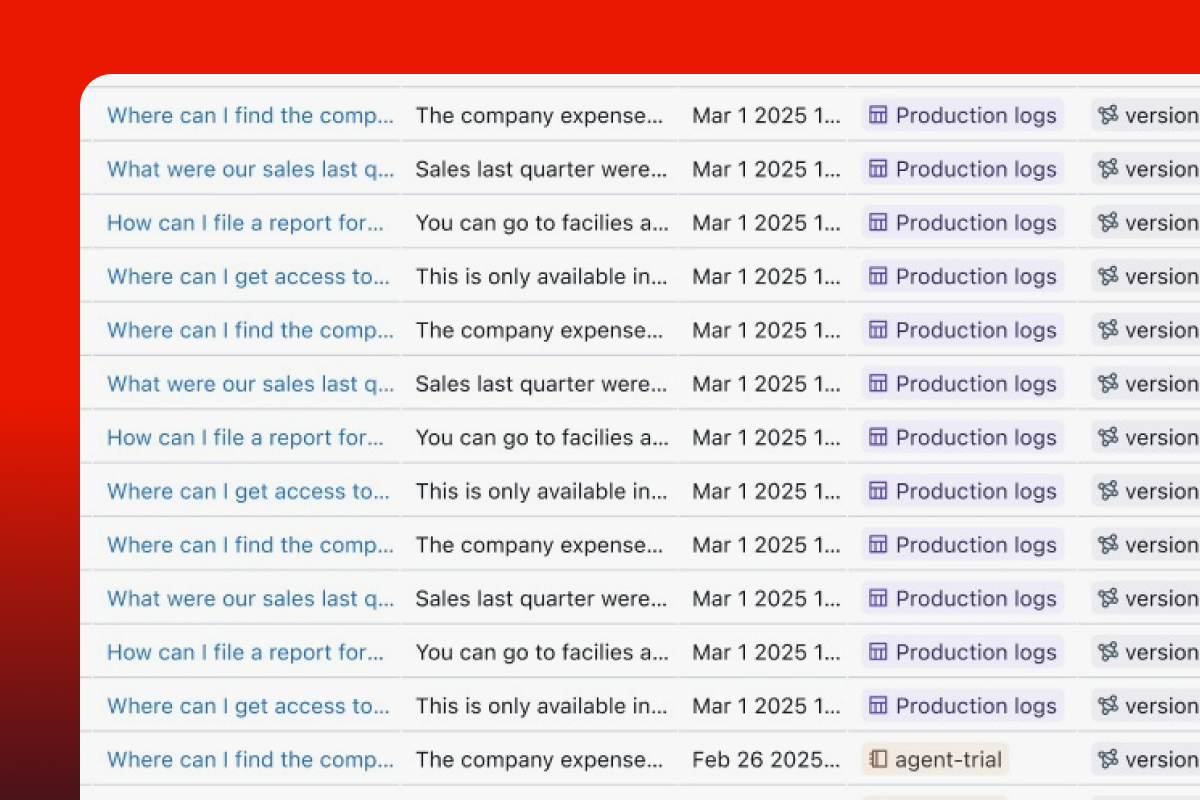
Instrument once, use in development and production
The same trace instrumentation works for production and development - so you can instrument once and get the same insight whether you are debugging in dev or observing in production.
OpenTelemetry compatible
Fully compatible with OpenTelemetry, so you can export traces to any OpenTelemetry compatible tool, providing you total ownership and portability of your generative AI data.
Get started with MLflow
Choose from two options depending on your needs
GET INVOLVED
Connect with the open source community
Join millions of MLflow users