Ship high-quality GenAI, fast
Mastering the ML lifecycle
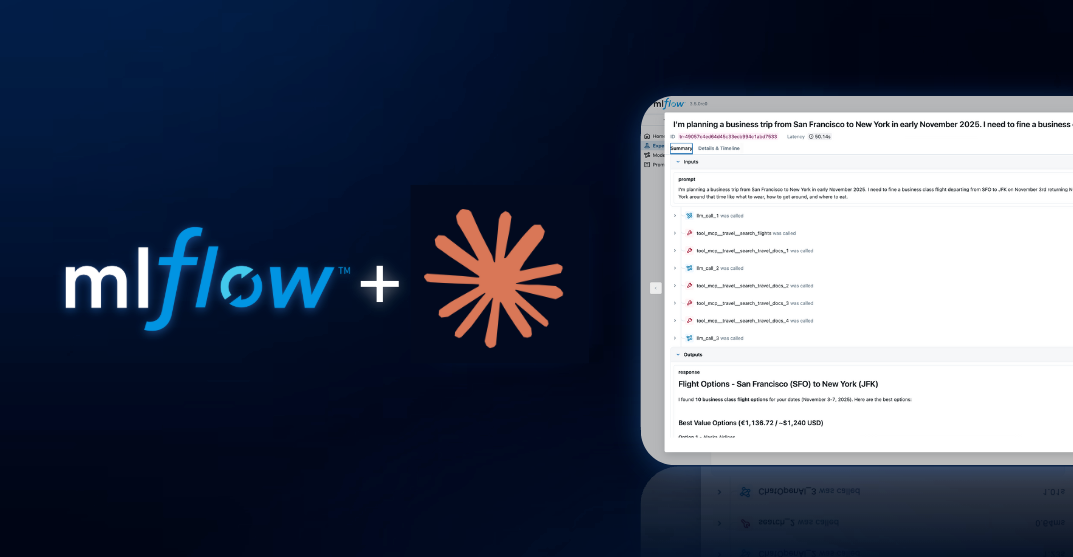
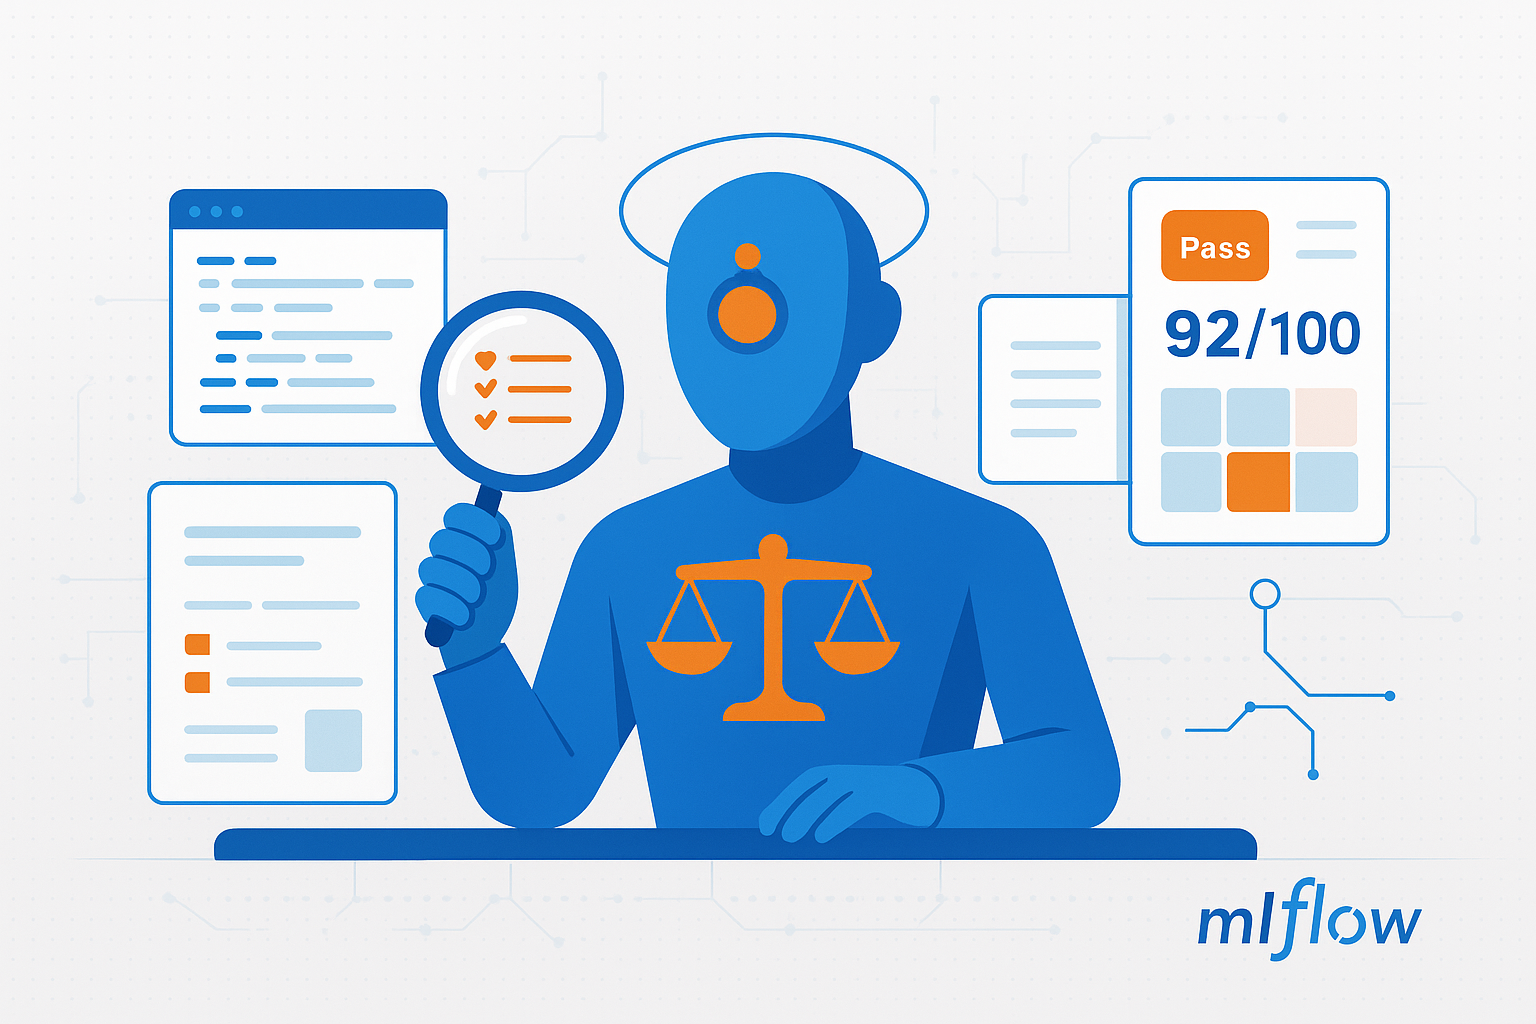
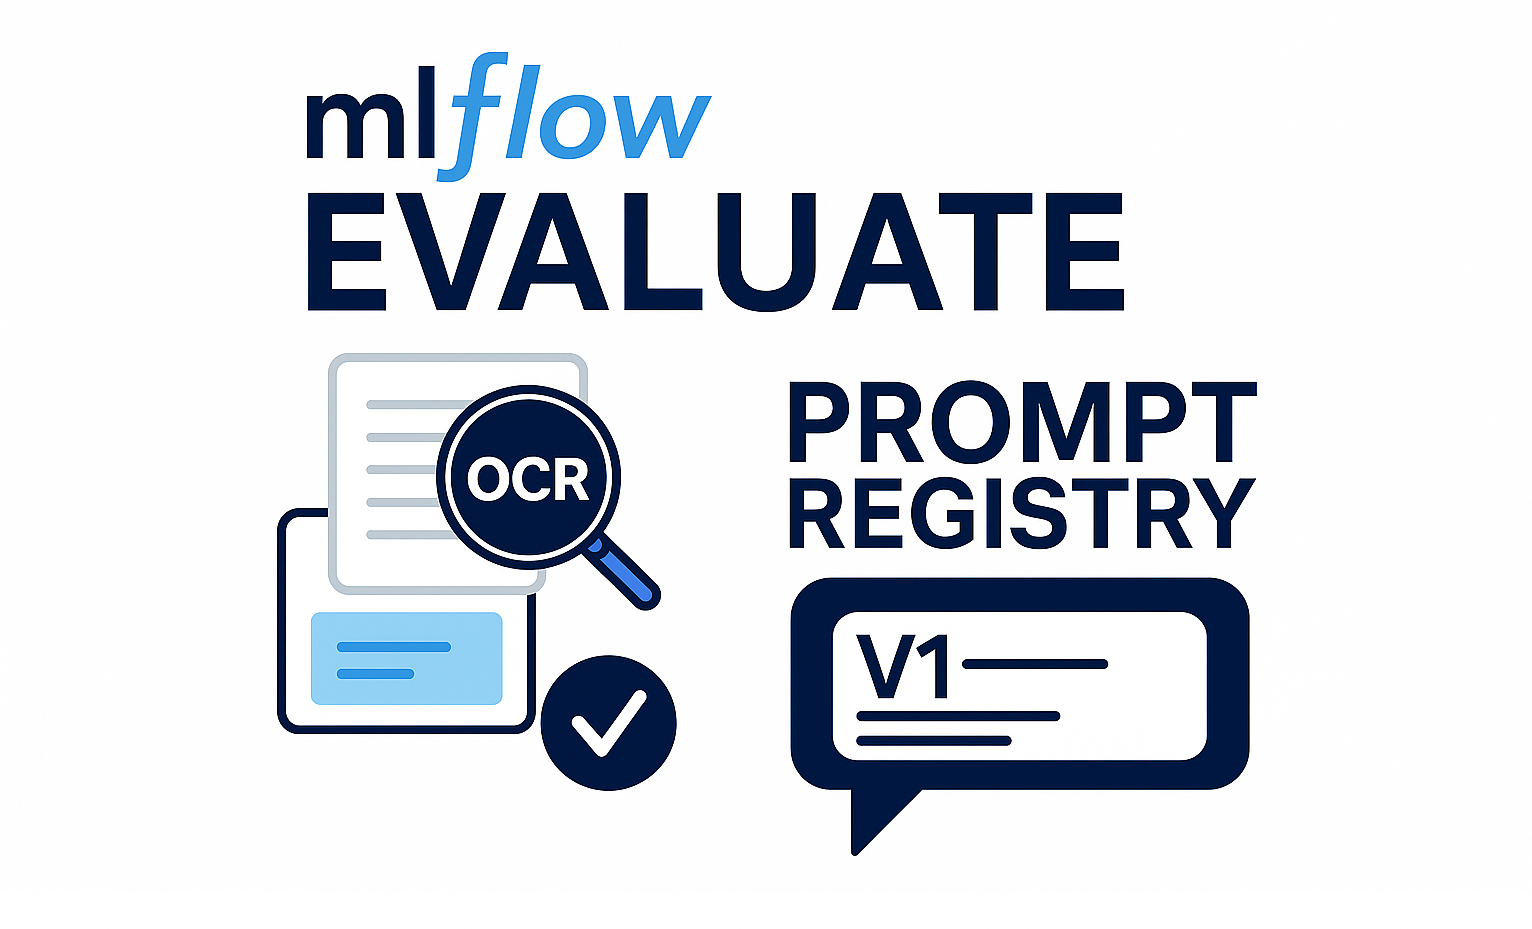
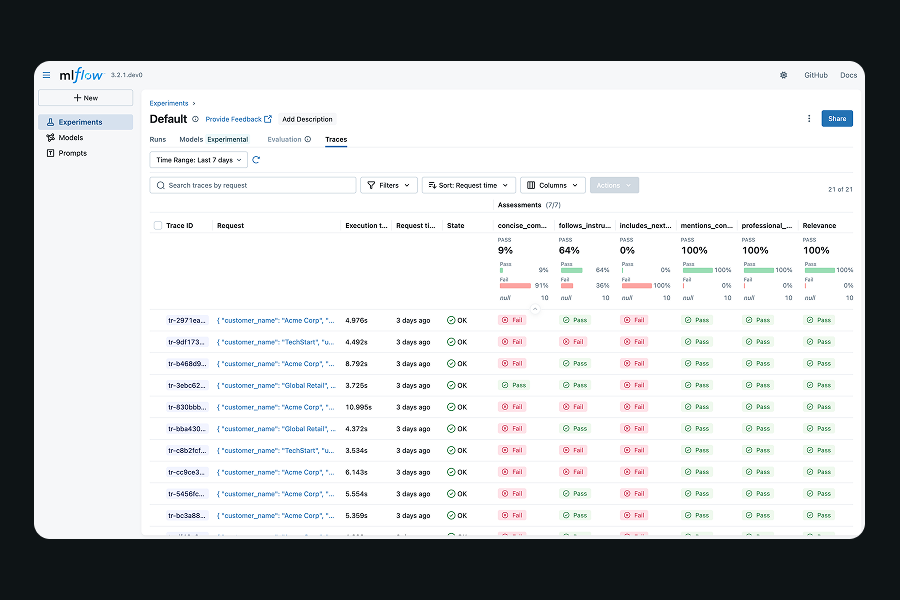
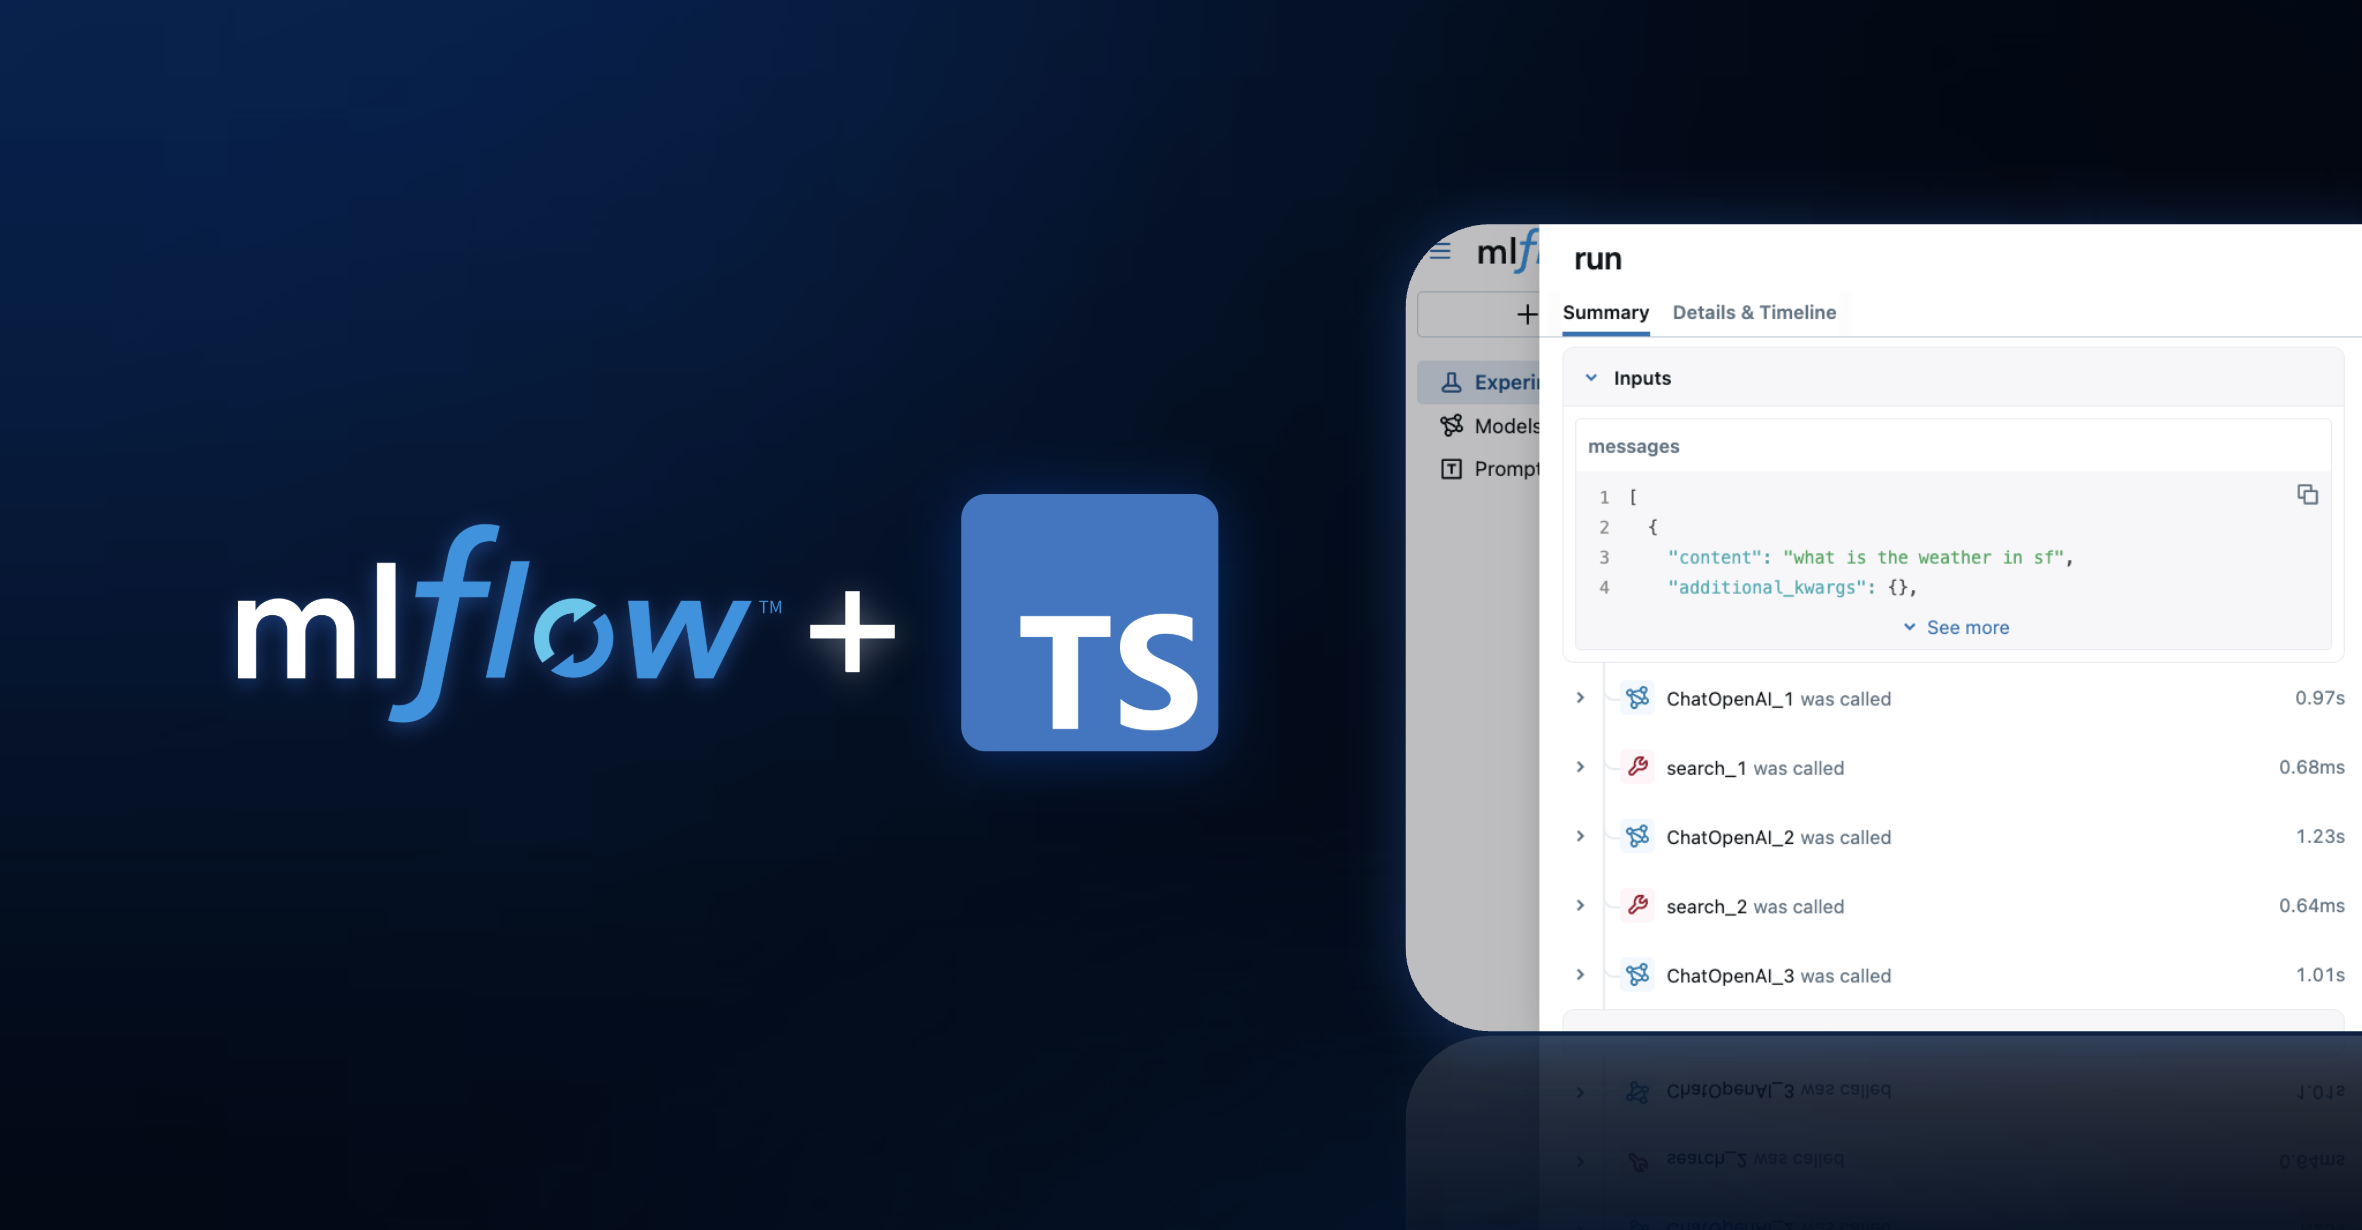
Learn how to track, evaluate, and optimize your GenAI applications and agent workflows.
Get started with the core functionality for traditional machine learning workflows, hyperparameter tuning, and model lifecycle management.