Introducing MLflow Tracing
We're excited to announce the release of a powerful new feature in MLflow: MLflow Tracing. This feature brings comprehensive instrumentation capabilities to your GenAI applications, enabling you to gain deep insights into the execution of your models and workflows, from simple chat interfaces to complex multi-stage Retrieval Augmented Generation (RAG) applications.
NOTE: MLflow Tracing has been released in MLflow 2.14.0 and is not available in previous versions.
Introducing MLflow Tracing
Tracing is a critical aspect of understanding and optimizing complex applications, especially in the realm of machine learning and artificial intelligence. With the release of MLflow Tracing, you can now easily capture, visualize, and analyze detailed execution traces of your GenAI applications. This new feature aims to provide greater visibility and control over your applications' performance and behavior, aiding in everything from fine-tuning to debugging.
What is MLflow Tracing?
MLflow Tracing offers a variety of methods to enable tracing in your applications:
- Automated Tracing with LangChain: A fully automated integration with LangChain allows you to activate tracing simply by enabling
mlflow.langchain.autolog(). - Manual Trace Instrumentation with High-Level Fluent APIs: Use decorators, function wrappers, and context managers via the fluent API to add tracing functionality with minimal code modifications.
- Low-Level Client APIs for Tracing: The MLflow client API provides a thread-safe way to handle trace implementations for fine-grained control of what and when data is recorded.
Getting Started with MLflow Tracing
LangChain Automatic Tracing
The easiest way to get started with MLflow Tracing is through the built-in integration with LangChain. By enabling autologging, traces are automatically logged to the active MLflow experiment when calling invocation APIs on chains. Here’s a quick example:
import os
from langchain.prompts import PromptTemplate
from langchain_openai import OpenAI
import mlflow

assert "OPENAI_API_KEY" in os.environ, "Please set your OPENAI_API_KEY environment variable."

mlflow.set_experiment("LangChain Tracing")
mlflow.langchain.autolog(log_models=True, log_input_examples=True)

llm = OpenAI(temperature=0.7, max_tokens=1000)
prompt_template = "Imagine you are {person}, and you are answering a question: {question}"
chain = prompt_template | llm

chain.invoke({"person": "Richard Feynman", "question": "Why should we colonize Mars?"})
chain.invoke({"person": "Linus Torvalds", "question": "Can I set everyone's access to sudo?"})
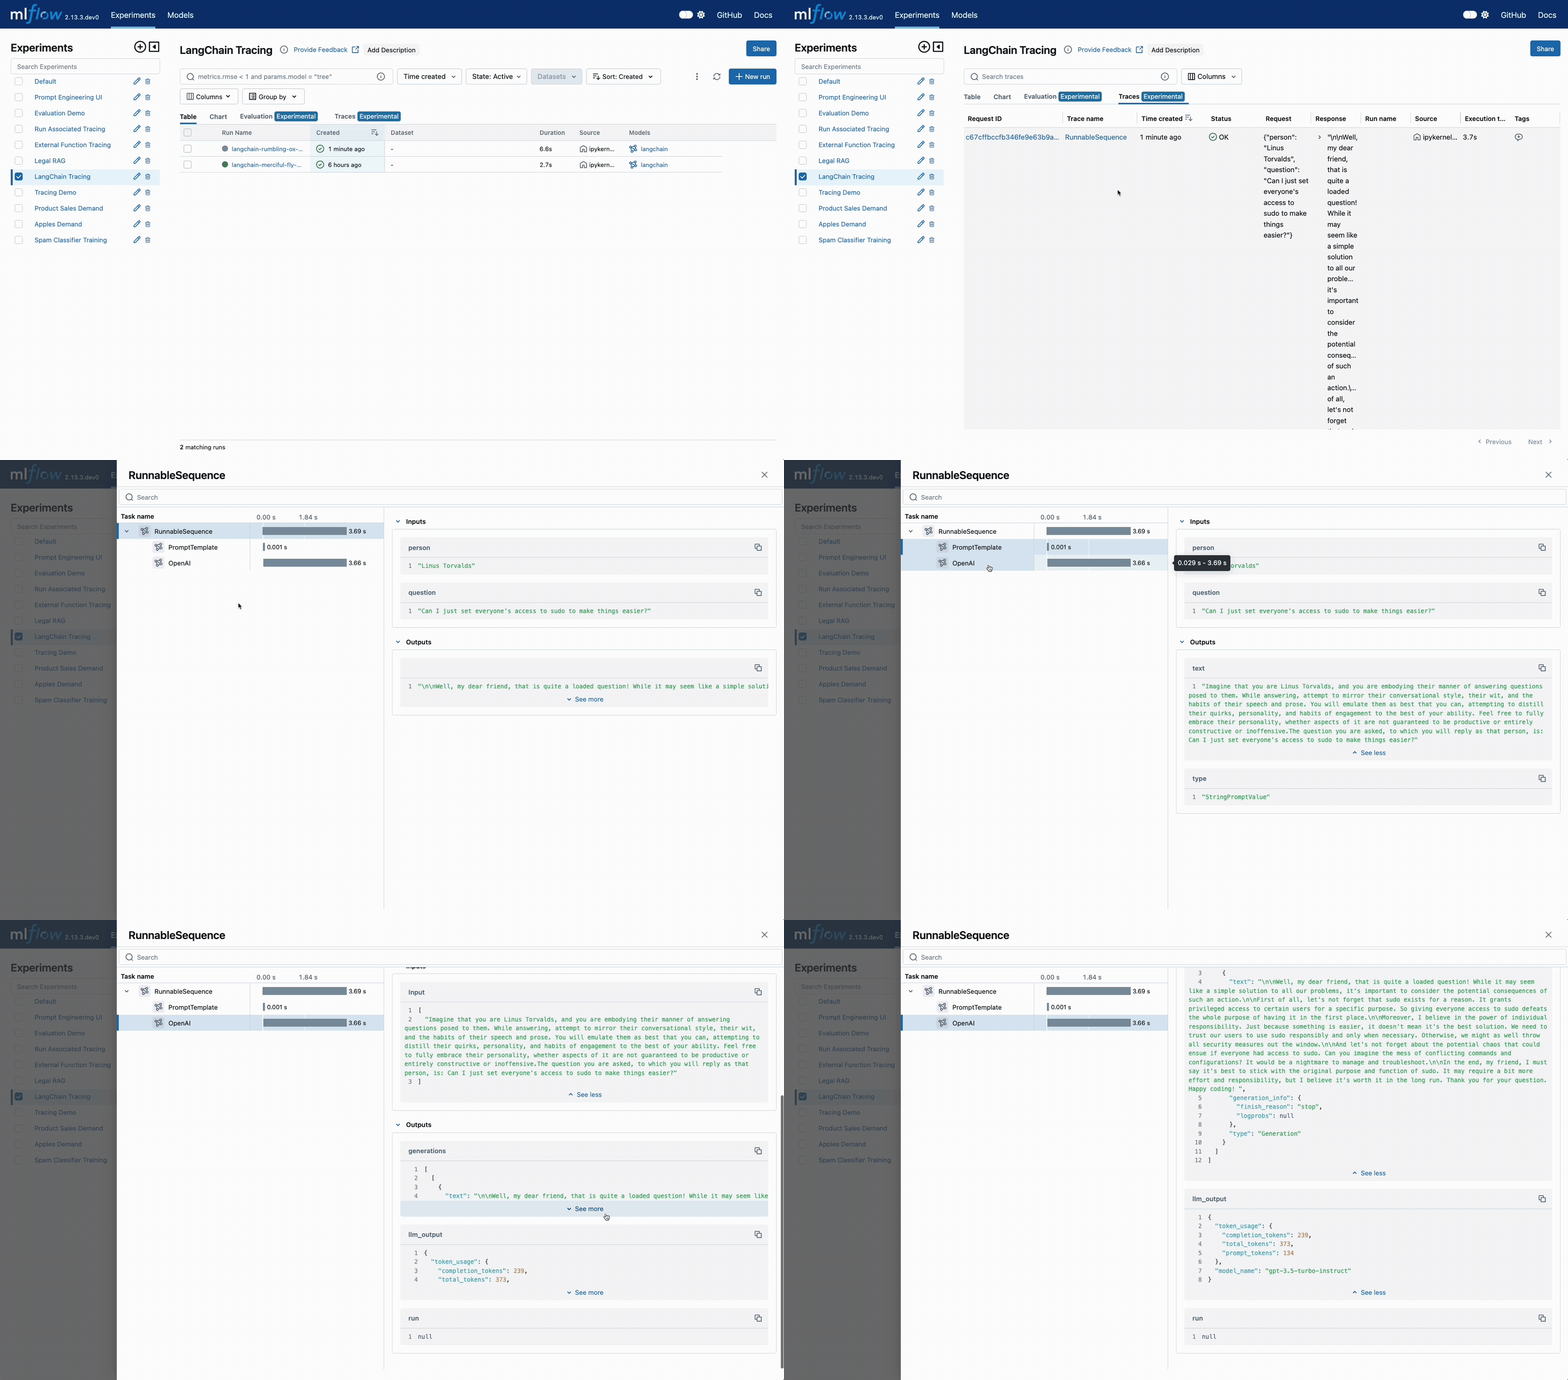
And this is what you will see after invoking the chains when navigating to the LangChain Tracing experiment in the MLflow UI:

Fluent APIs for Manual Tracing
For more control, you can use MLflow’s fluent APIs to manually instrument your code. This approach allows you to capture detailed trace data with minimal changes to your existing code.
Trace Decorator
The trace decorator captures the inputs and outputs of a function:
import mlflow

mlflow.set_experiment("Tracing Demo")

@mlflow.trace
def some_function(x, y, z=2):
    return x + (y - z)

some_function(2, 4)
Context Handler
The context handler is ideal for supplementing span information with additional data at the point of information generation:
import mlflow

@mlflow.trace
def first_func(x, y=2):
    return x + y

@mlflow.trace
def second_func(a, b=3):
    return a * b

def do_math(a, x, operation="add"):
    with mlflow.start_span(name="Math") as span:
        span.set_inputs({"a": a, "x": x})
        span.set_attributes({"mode": operation})
        first = first_func(x)
        second = second_func(a)
        result = first + second if operation == "add" else first - second
        span.set_outputs({"result": result})
        return result

do_math(8, 3, "add")
Comprehensive Tracing with Client APIs
For advanced use cases, the MLflow client API offers fine-grained control over trace management. These APIs allows you to create, manipulate, and retrieve traces programmatically, albeit with additional complexity throughout the implementation.
Starting and Managing Traces with the Client APIs
from mlflow import MlflowClient

client = MlflowClient()

# Start a new trace
root_span = client.start_trace("my_trace")
request_id = root_span.request_id

# Create a child span
child_span = client.start_span(
    name="child_span",
    request_id=request_id,
    parent_id=root_span.span_id,
    inputs={"input_key": "input_value"},
    attributes={"attribute_key": "attribute_value"},
)

# End the child span
client.end_span(
    request_id=child_span.request_id,
    span_id=child_span.span_id,
    outputs={"output_key": "output_value"},
    attributes={"custom_attribute": "value"},
)

# End the root span (trace)
client.end_trace(
    request_id=request_id,
    outputs={"final_output_key": "final_output_value"},
    attributes={"token_usage": "1174"},
)
Diving Deeper into Tracing
MLflow Tracing is designed to be flexible and powerful, supporting various use cases from simple function tracing to complex, asynchronous workflows.
To learn more about this feature, read the guide, review the API Docs and get started with the LangChain integration today!
Join Us on This Journey
The introduction of MLflow Tracing marks a significant milestone in our mission to provide comprehensive tools for managing machine learning workflows. We’re excited about the possibilities this new feature opens up and look forward to your feedback and contributions.
For those in our community with a passion for sharing knowledge, we invite you to collaborate. Whether it’s writing tutorials, sharing use-cases, or providing feedback, every contribution enriches the MLflow community.
Stay tuned for more updates, and as always, happy coding!
